
Spotify Liked Songs analyzer: mood, BPM and genres in charts
The Stats page turns your Spotify Liked Songs into charts: mood, BPM, genres, release years, top artists, languages and how your taste changes.
Sign in with Spotify. The Free plan needs no card.
The Stats page turns your Spotify Liked Songs into charts: mood, BPM, genres, release years, top artists, languages and how your taste changes. Sign in with Spotify, open Stats, and every chart is drawn from the liked tracks your plan monitors. It counts liked tracks, not plays, because Playlistation never reads your listening history.
How to analyze your Spotify Liked Songs in three steps
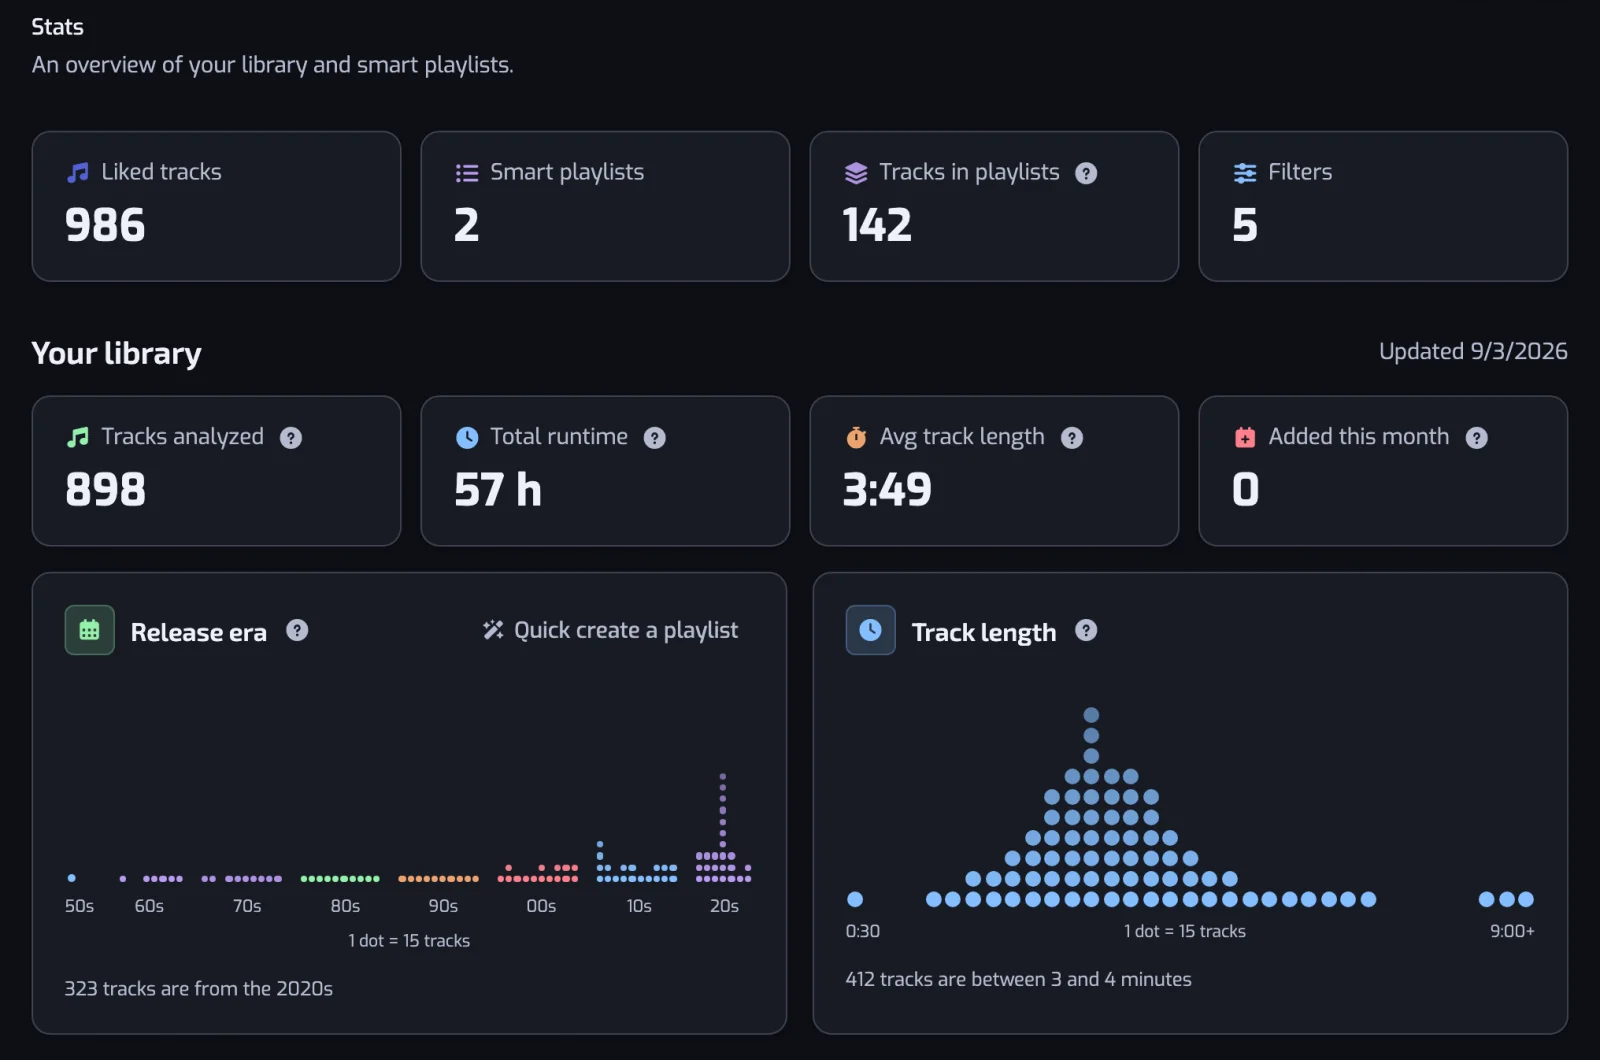
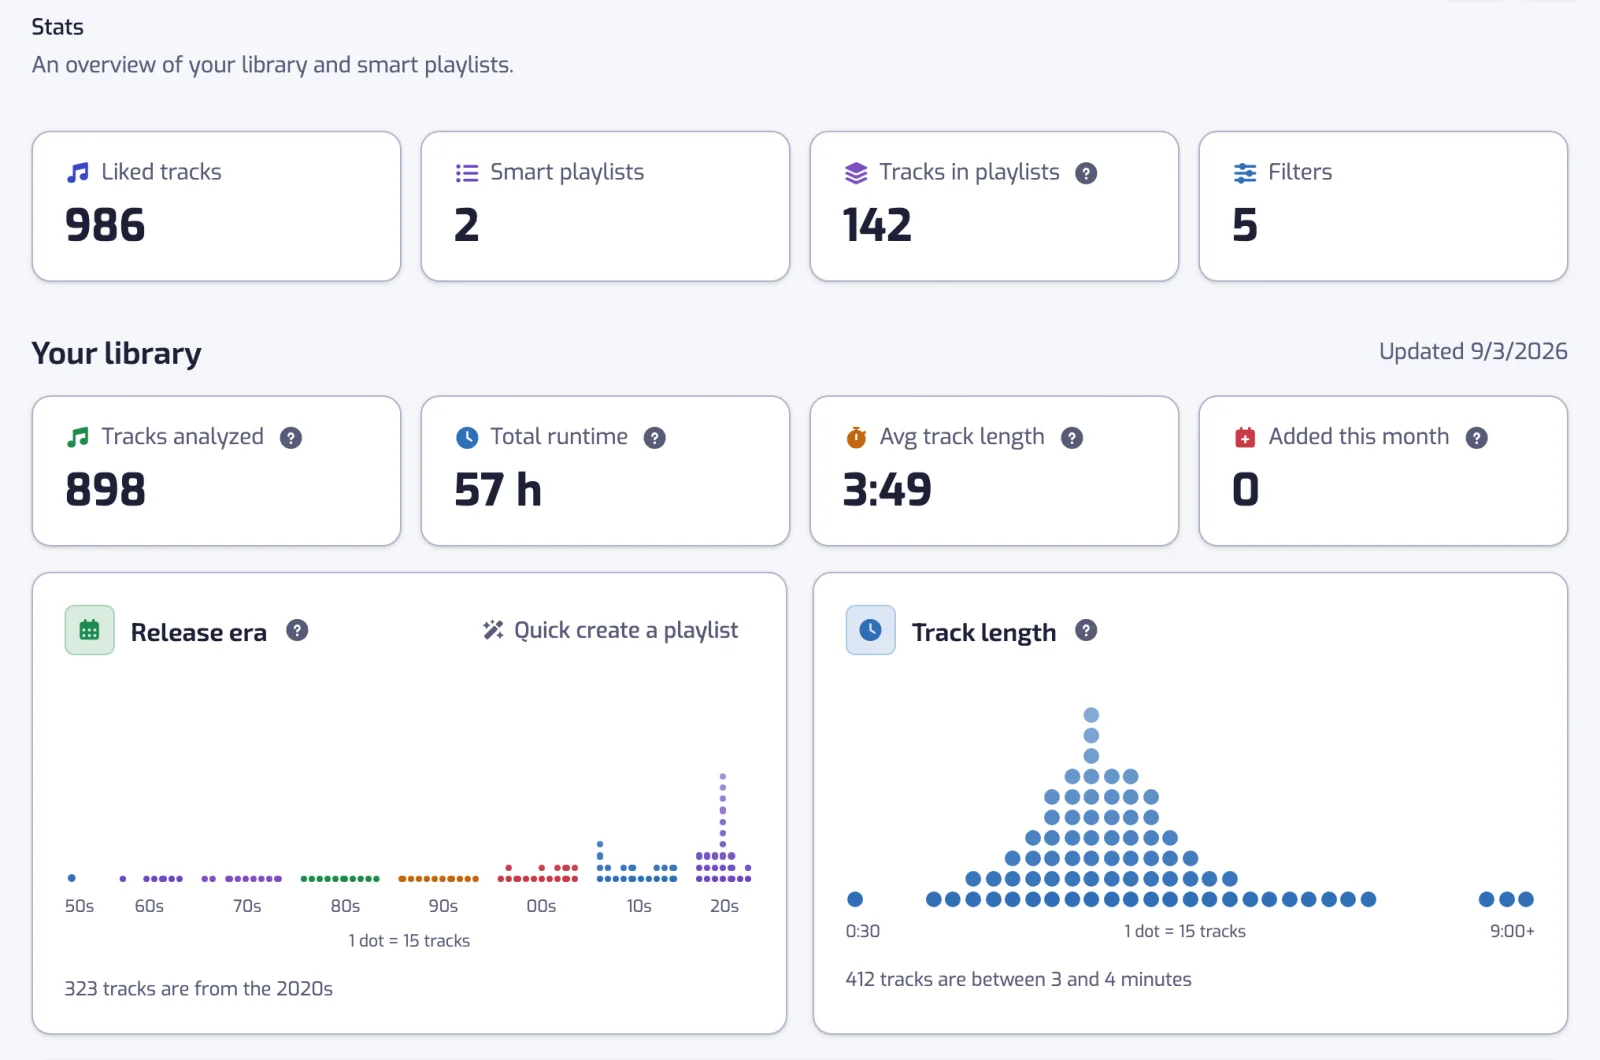
- Sign in with Spotify. Playlistation reads your Liked Songs once you allow it.
- Open the Stats page. The first time, it needs a moment to compute your charts. Come back a little later if it says so.
- Read the cards. Star the ones you want on your Home page, or use Quick create on a card that offers it to turn what you see into a playlist.
The charts every account gets
These eight cards show on every plan.
Release era
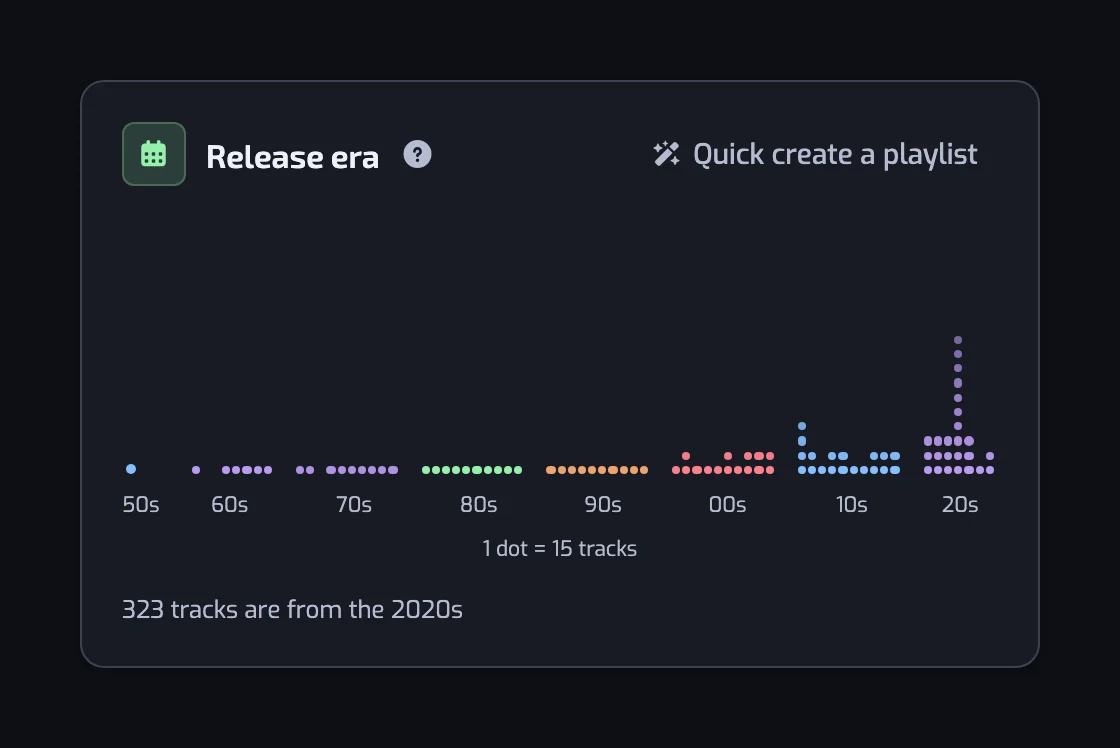
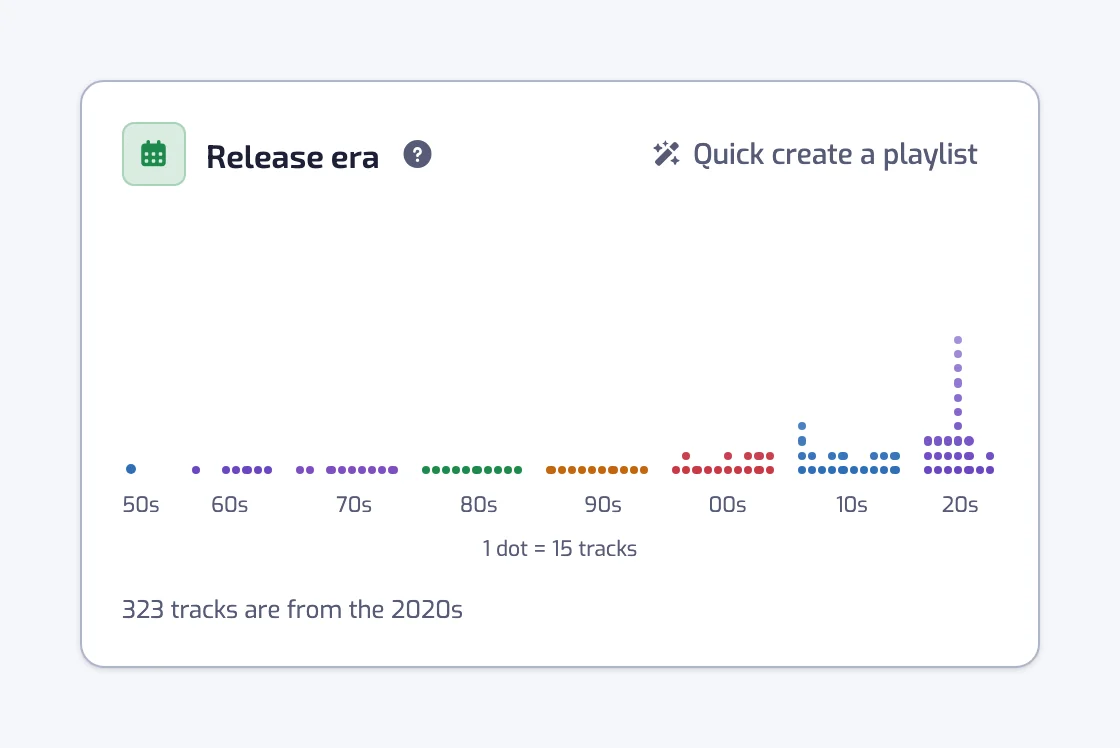
One dot column per release year, grouped by decade. The caption names the decade with the most tracks, so you see at once whether your library sits in the 90s or in the 2020s.
Track length
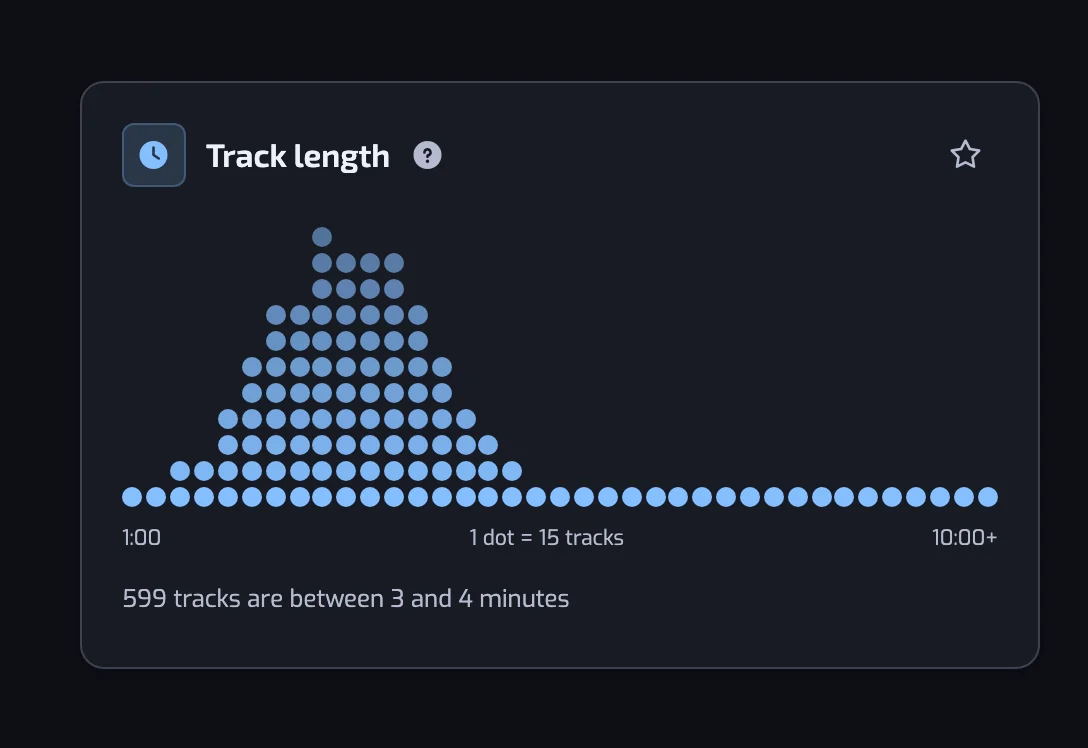
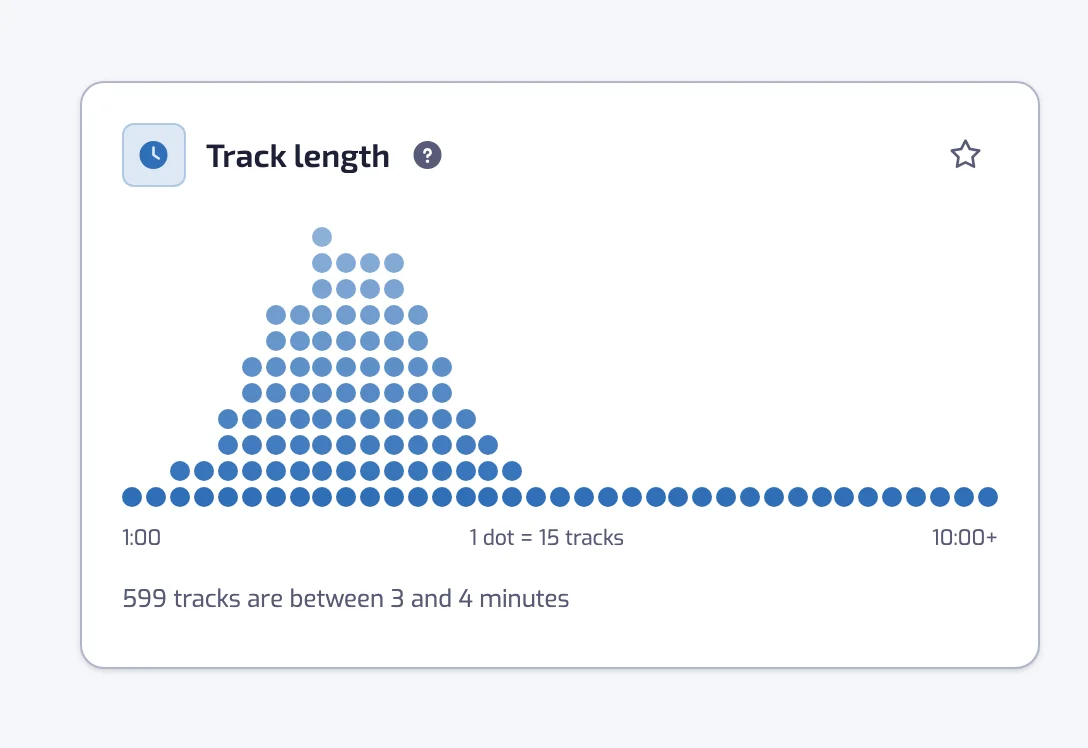
Columns of 15 seconds show how long your liked tracks run. The last column collects everything from 10 minutes up.
Likes by day
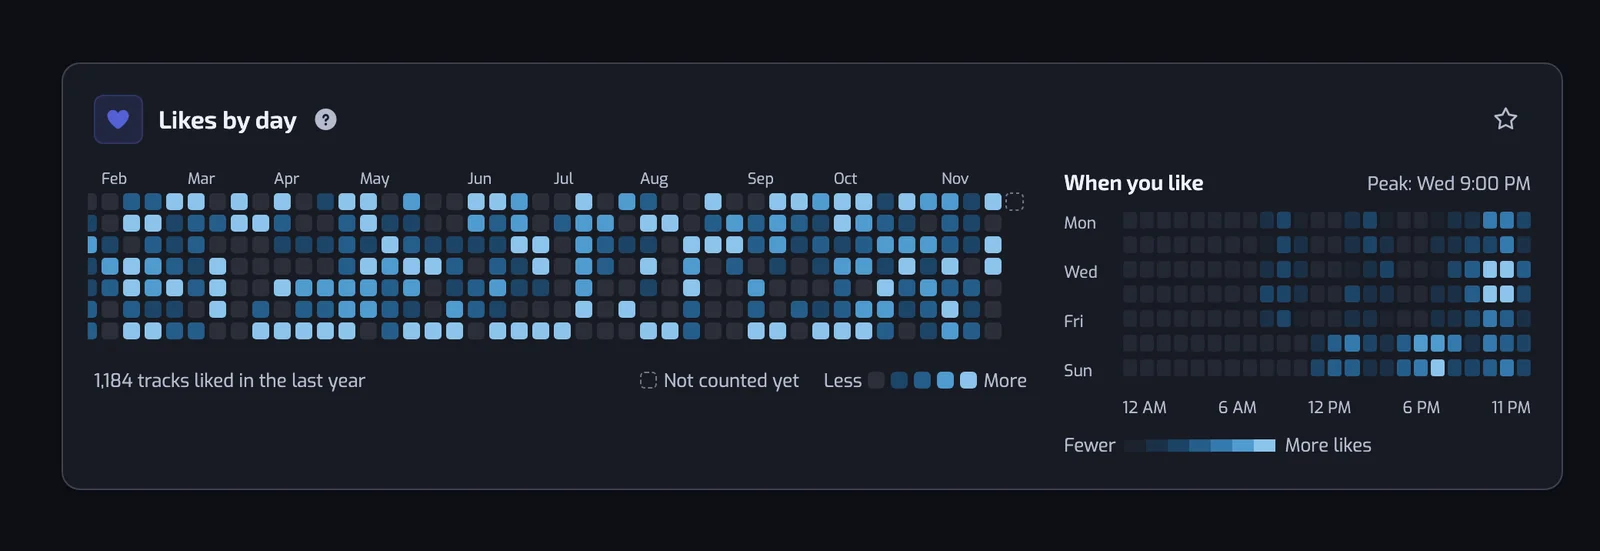
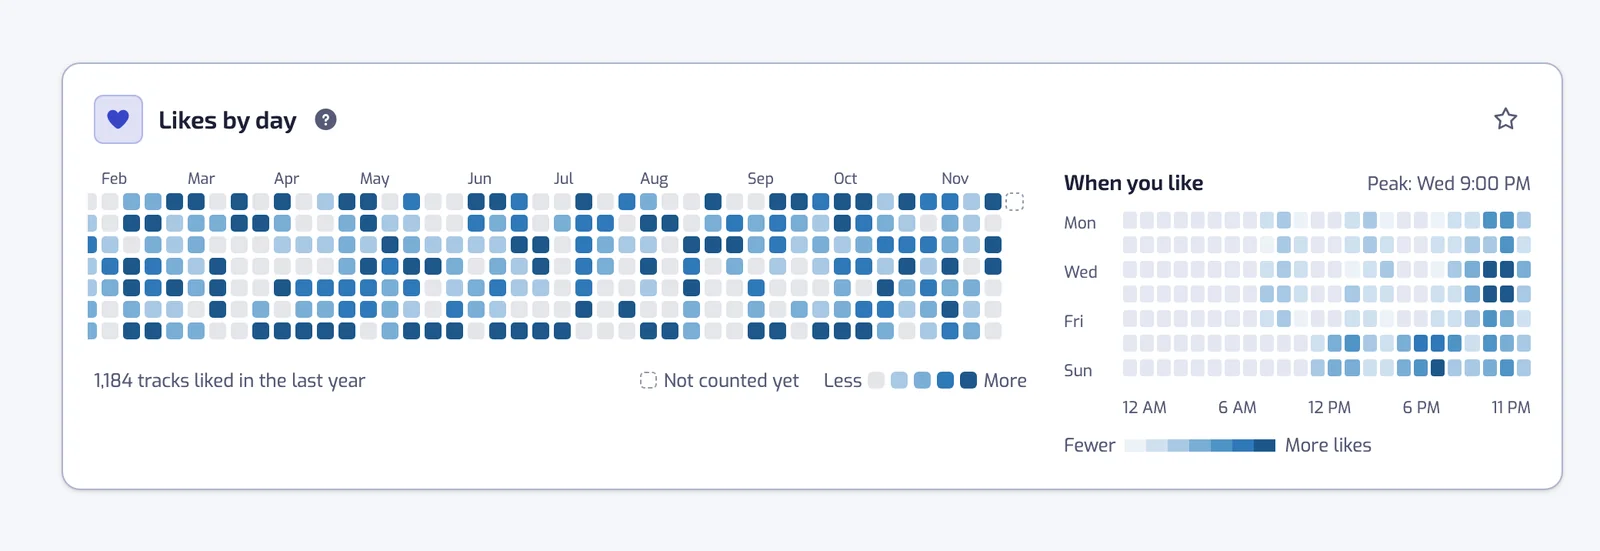
One square per day over the last 53 weeks, stronger on the days you liked more tracks. A busy week and a quiet month show up in one look.
Library growth
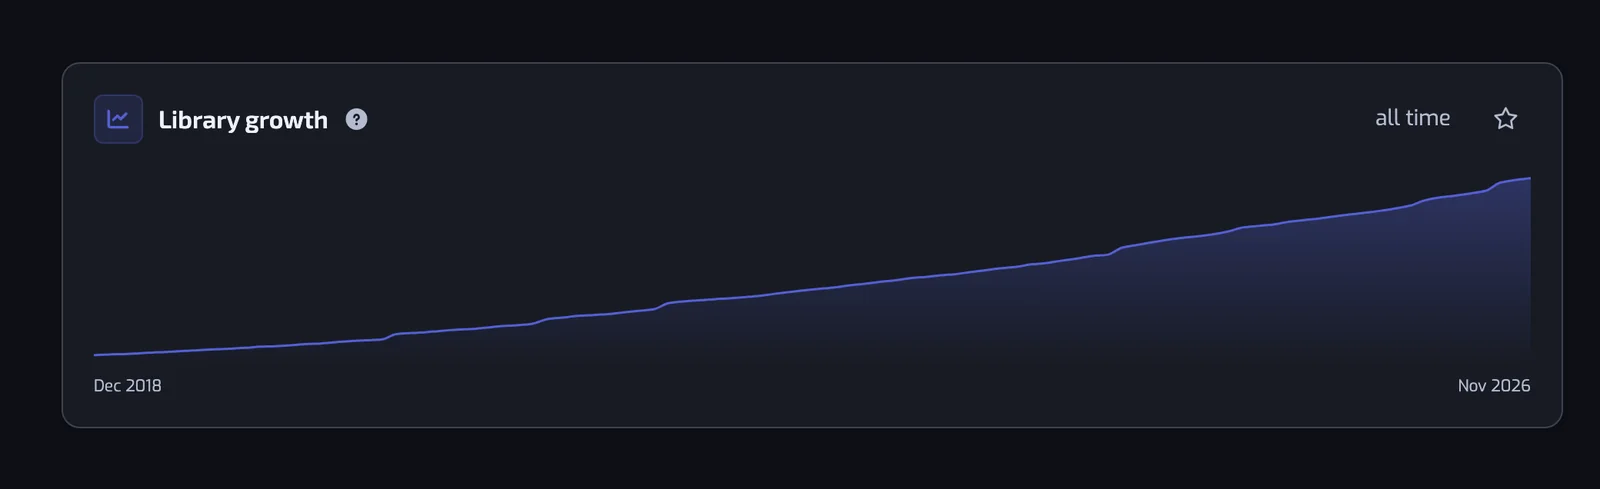
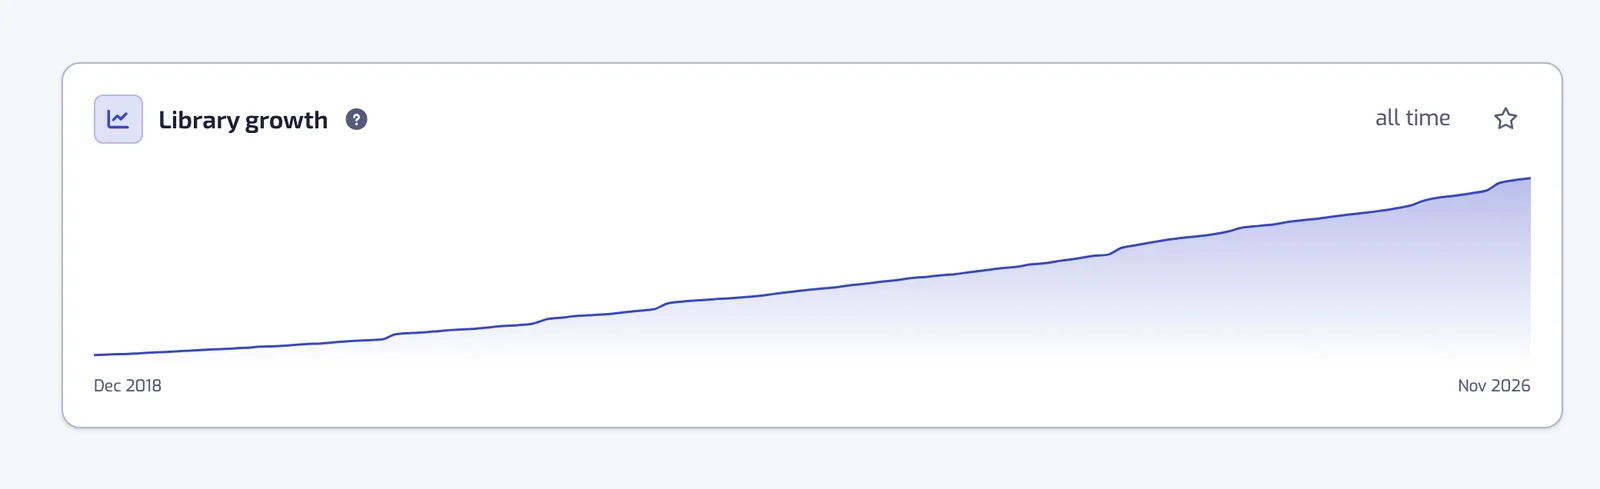
The running total of your library, month by month. It shows when the library grew fast and when it stalled.
Top genres
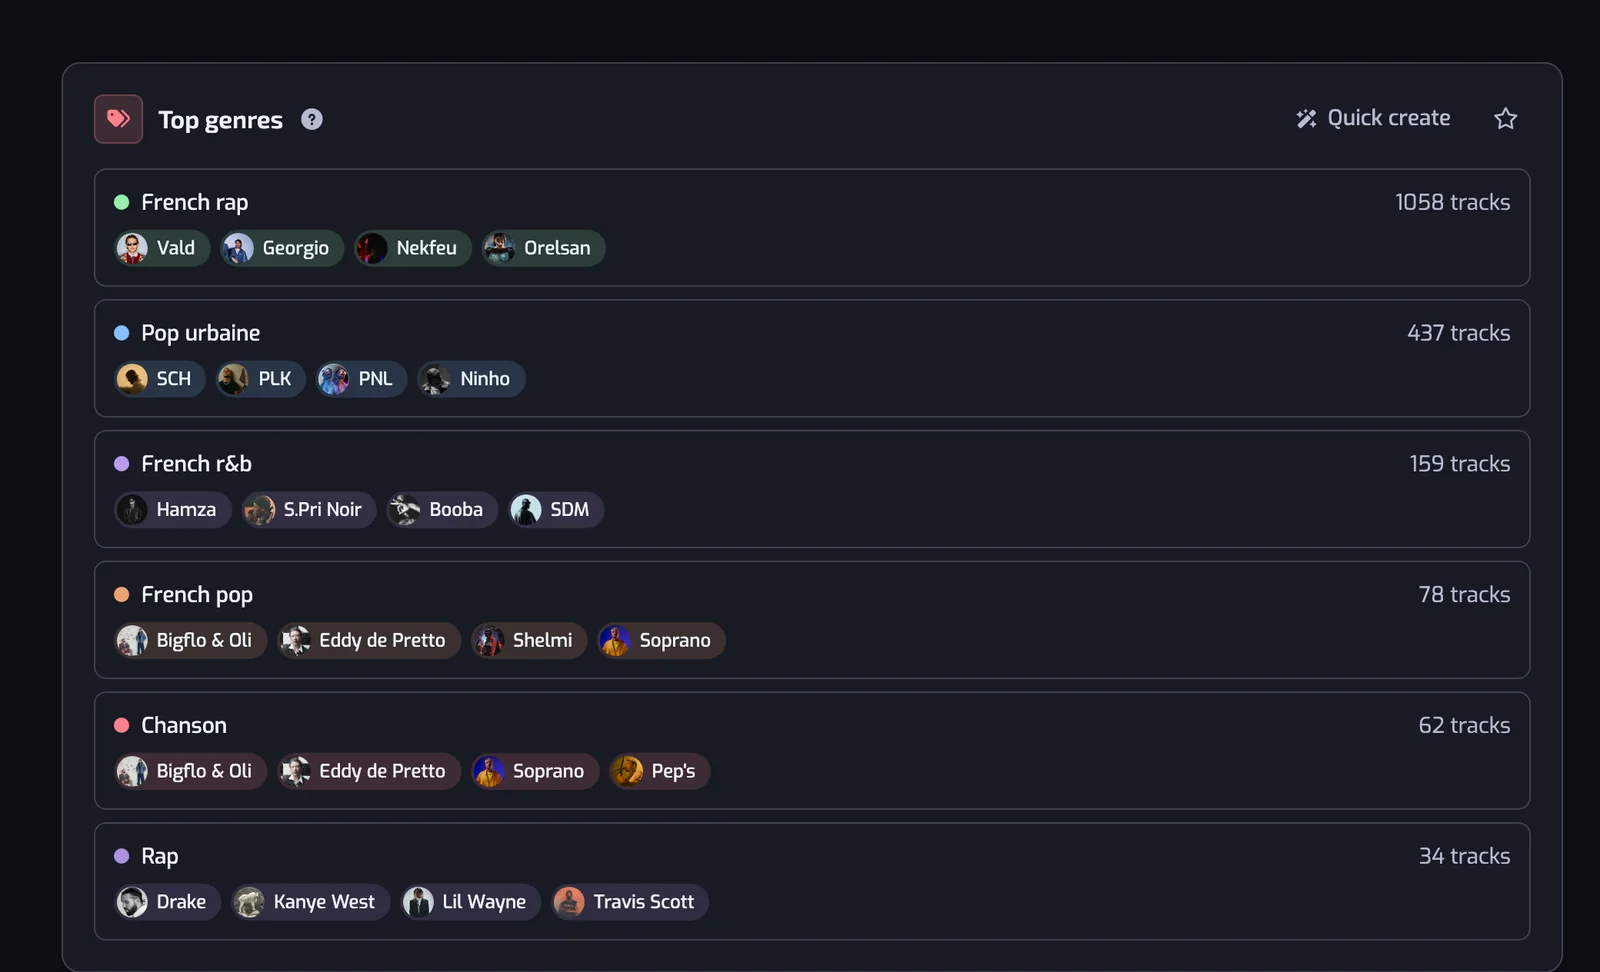
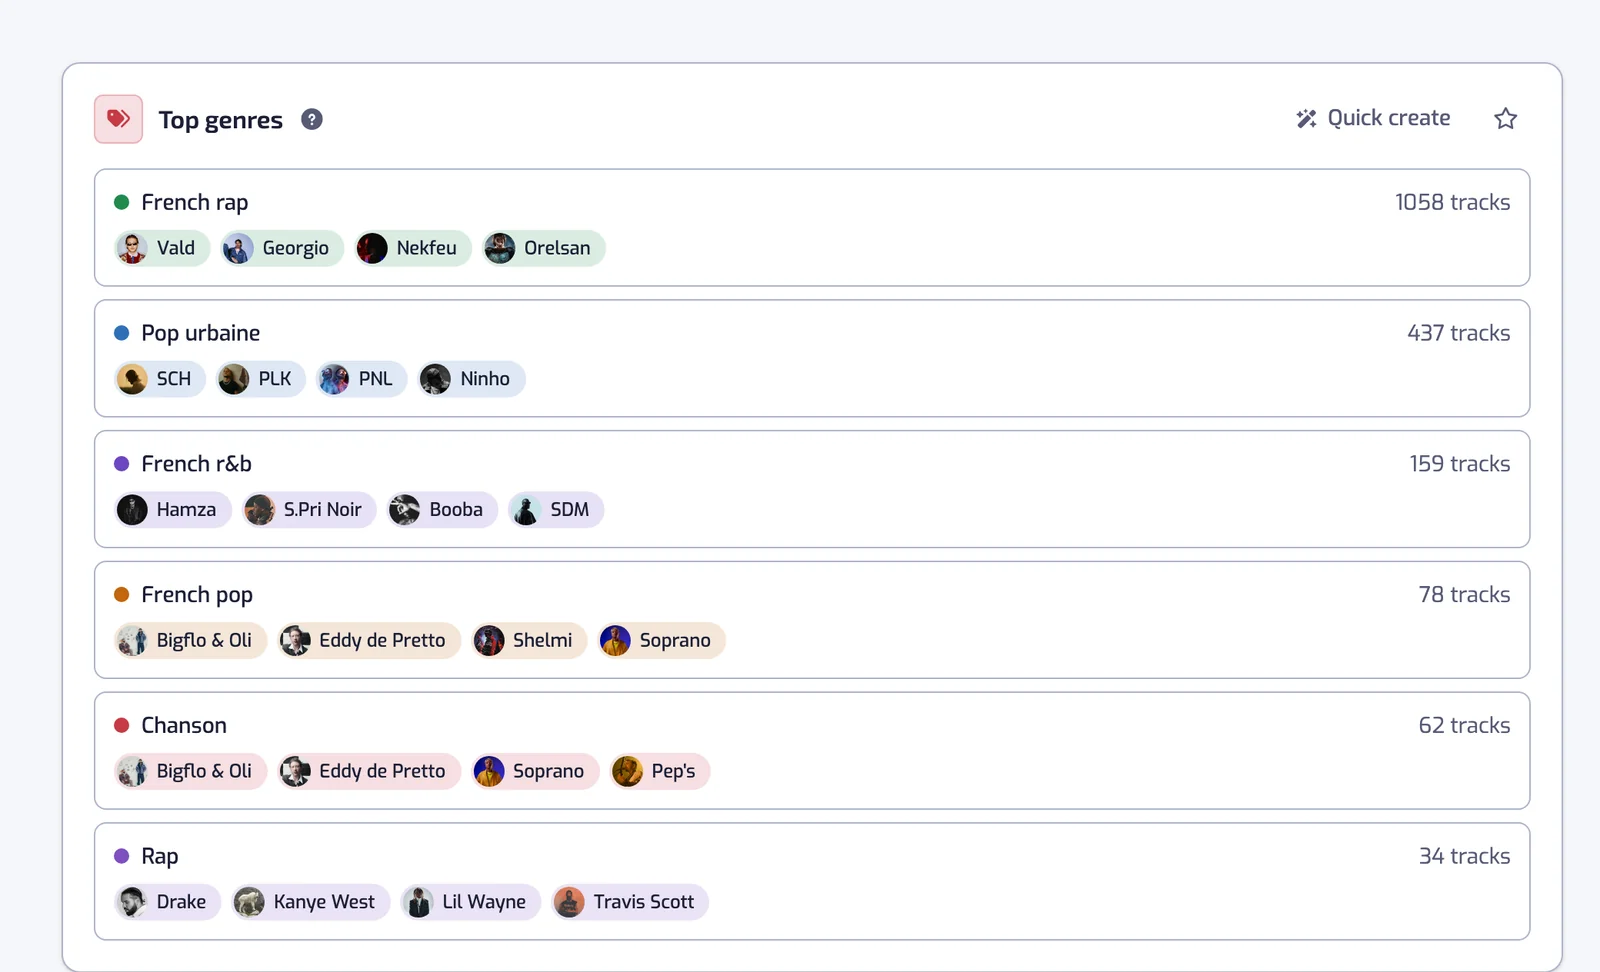
Your six most frequent genres, each with up to four of your artists from that genre.
Top artists
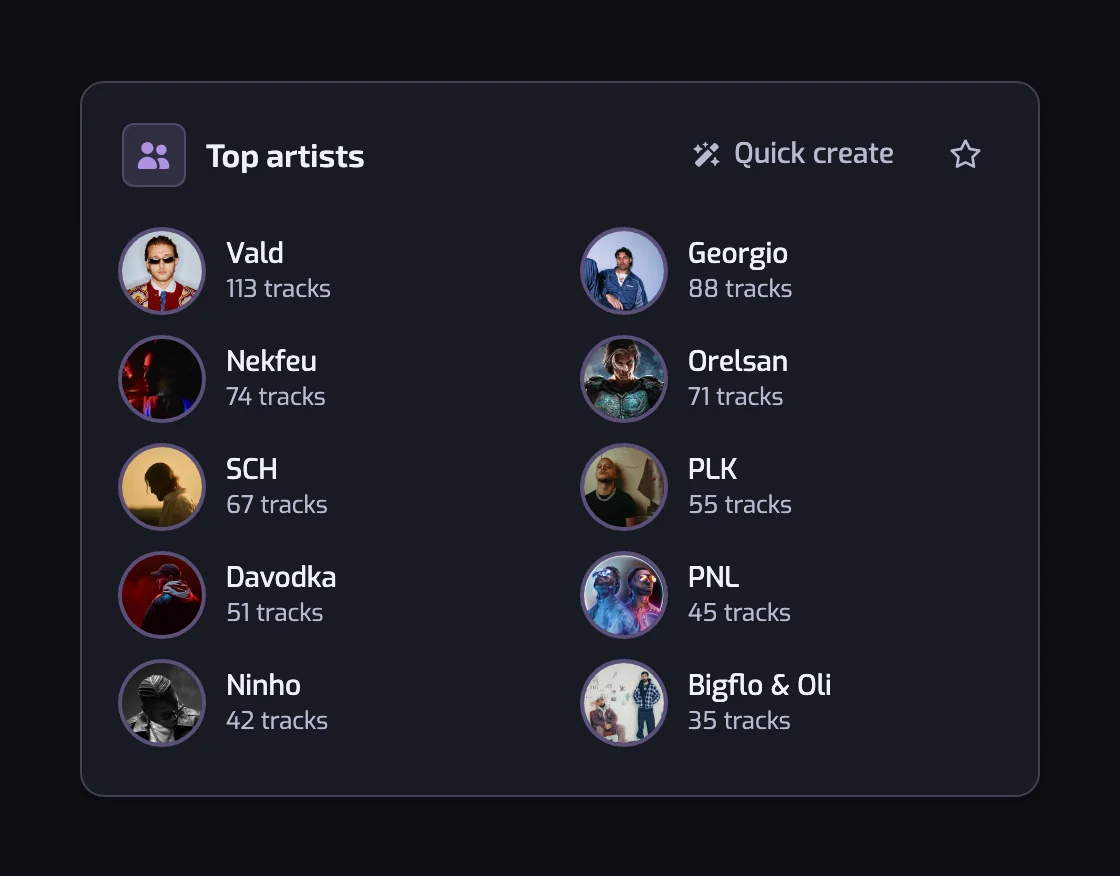
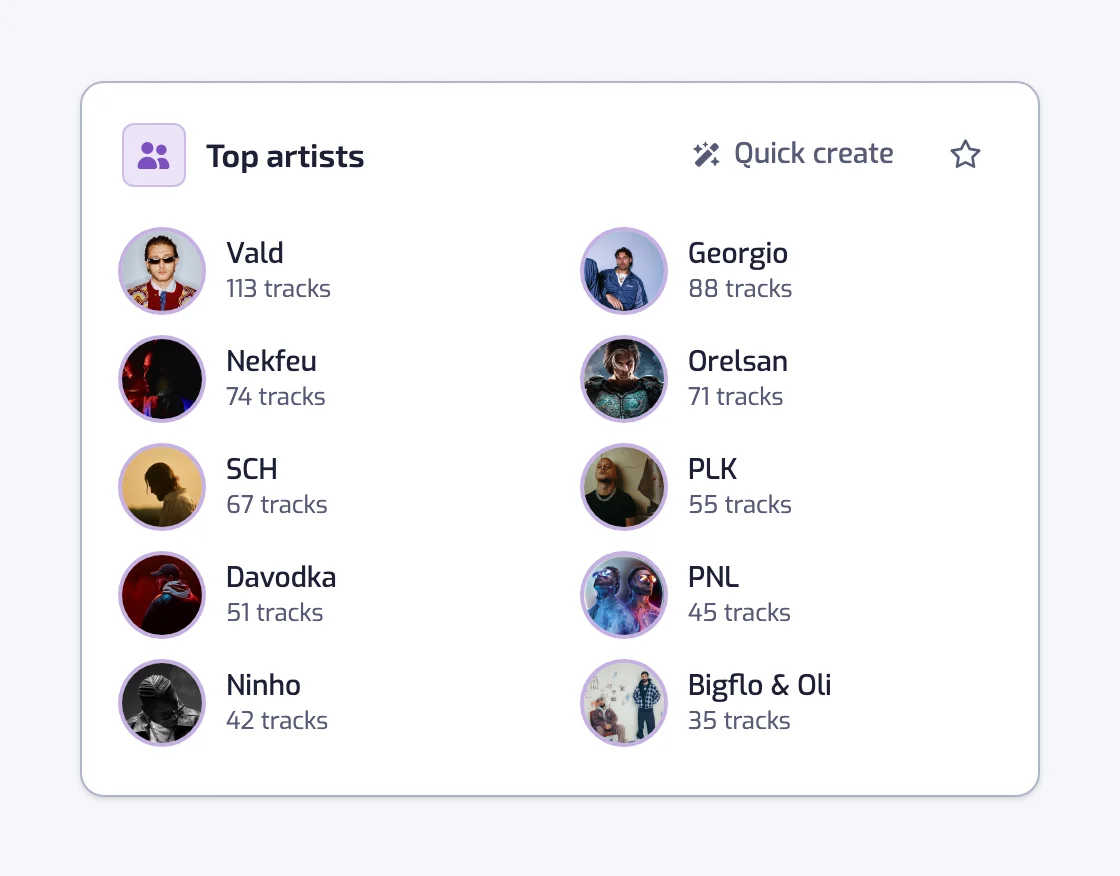
Your ten most frequent artists, each linking to Spotify. The ranking counts liked tracks, so it is not a list of the artists you played most.
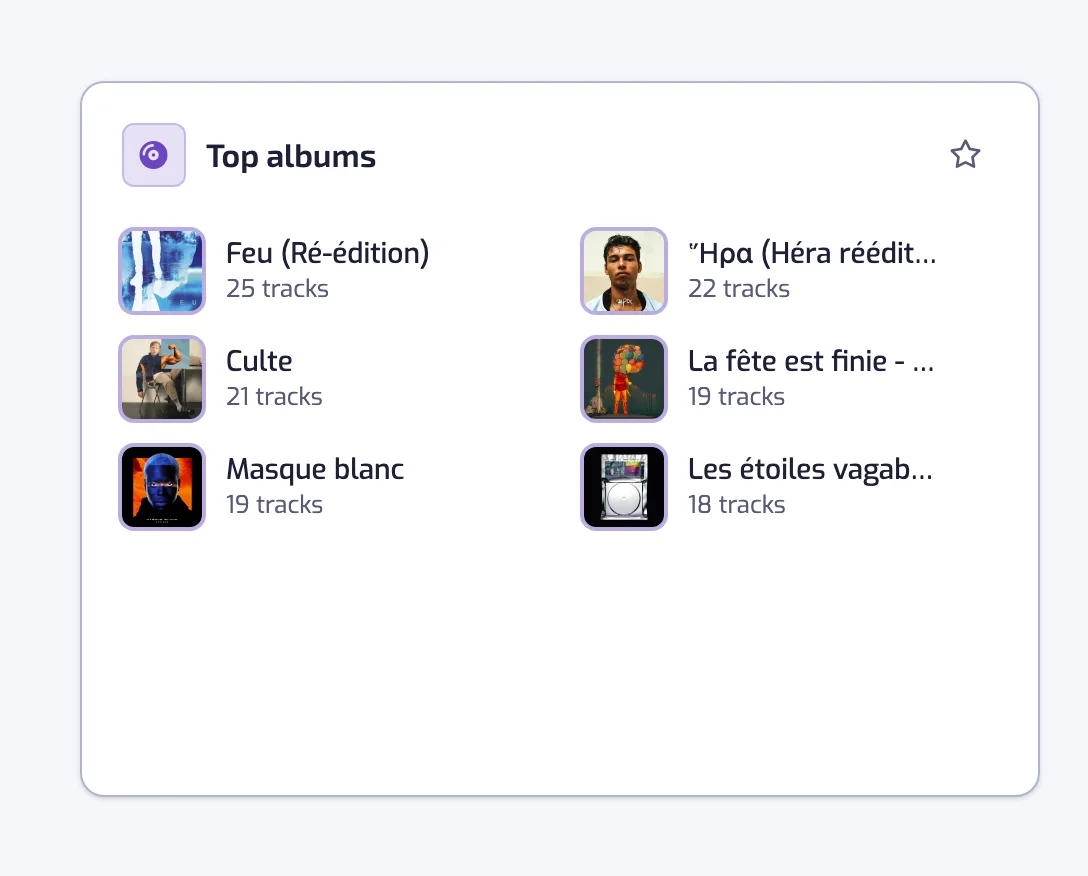
Top albums
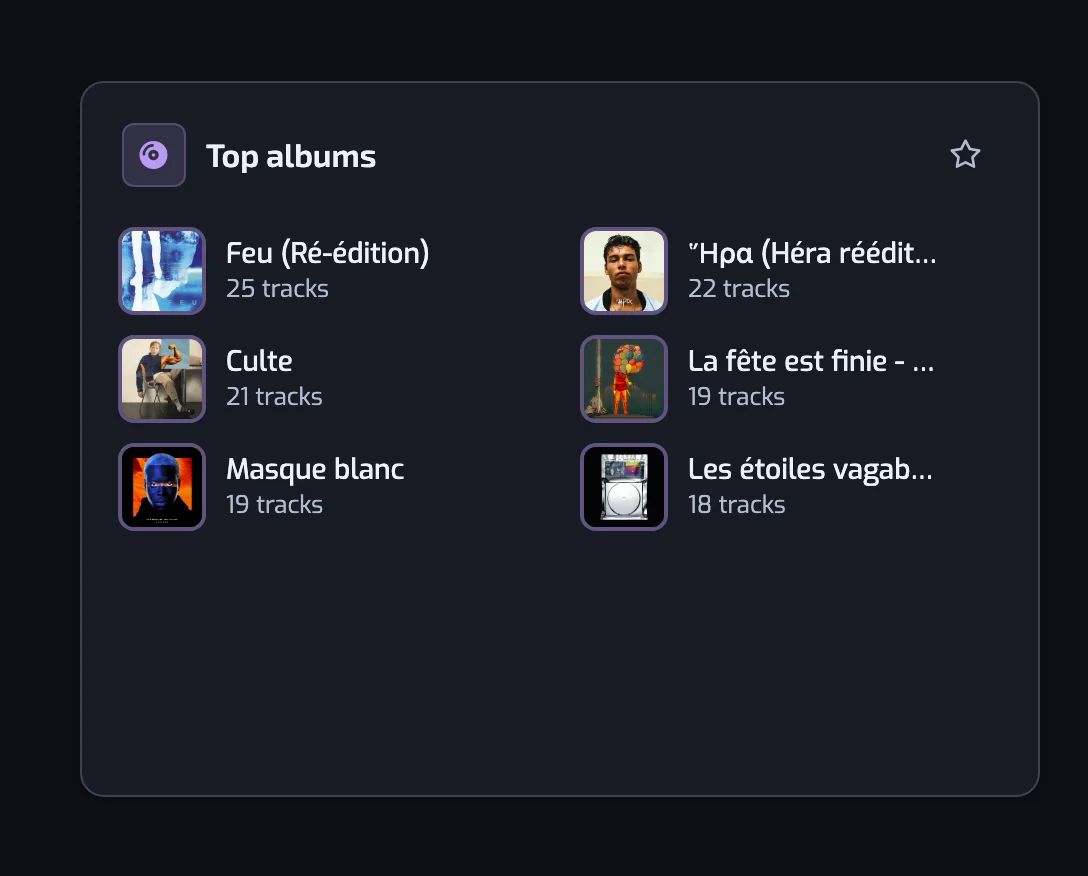
Your six most frequent albums, with their covers and a link to each album on Spotify.
Languages
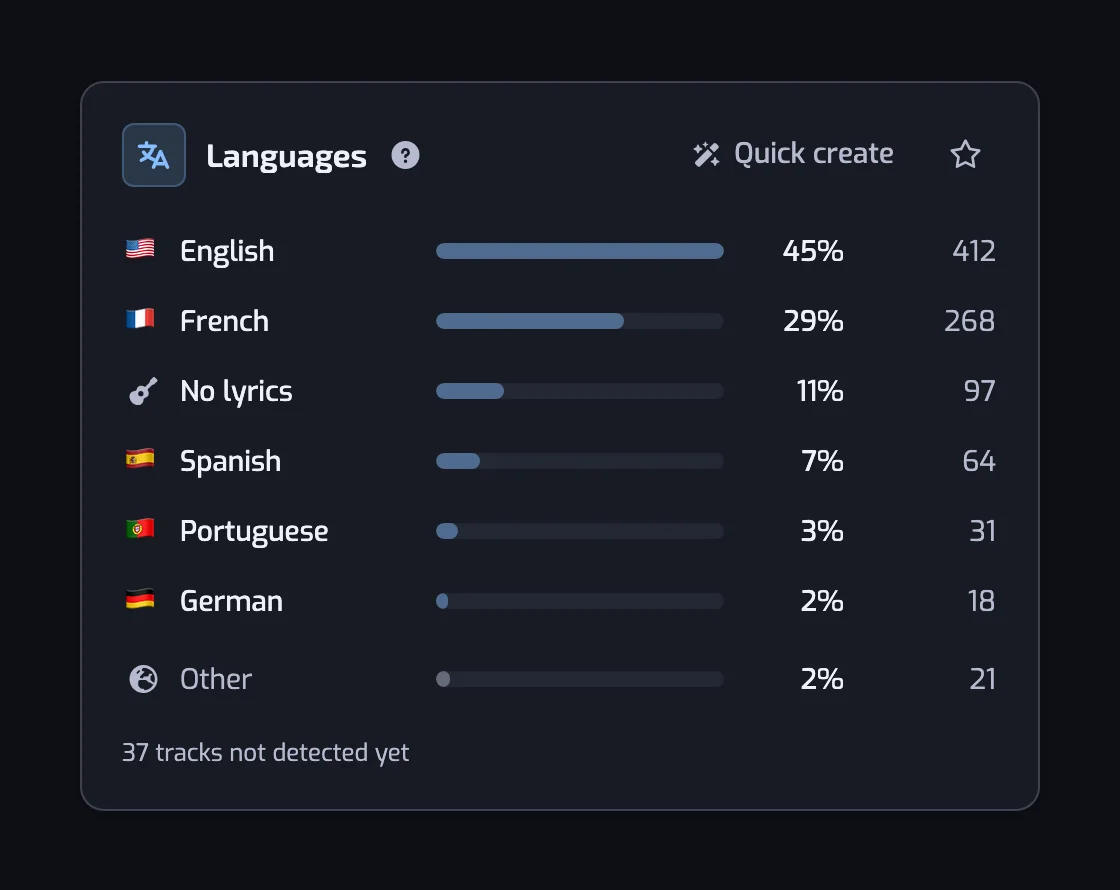
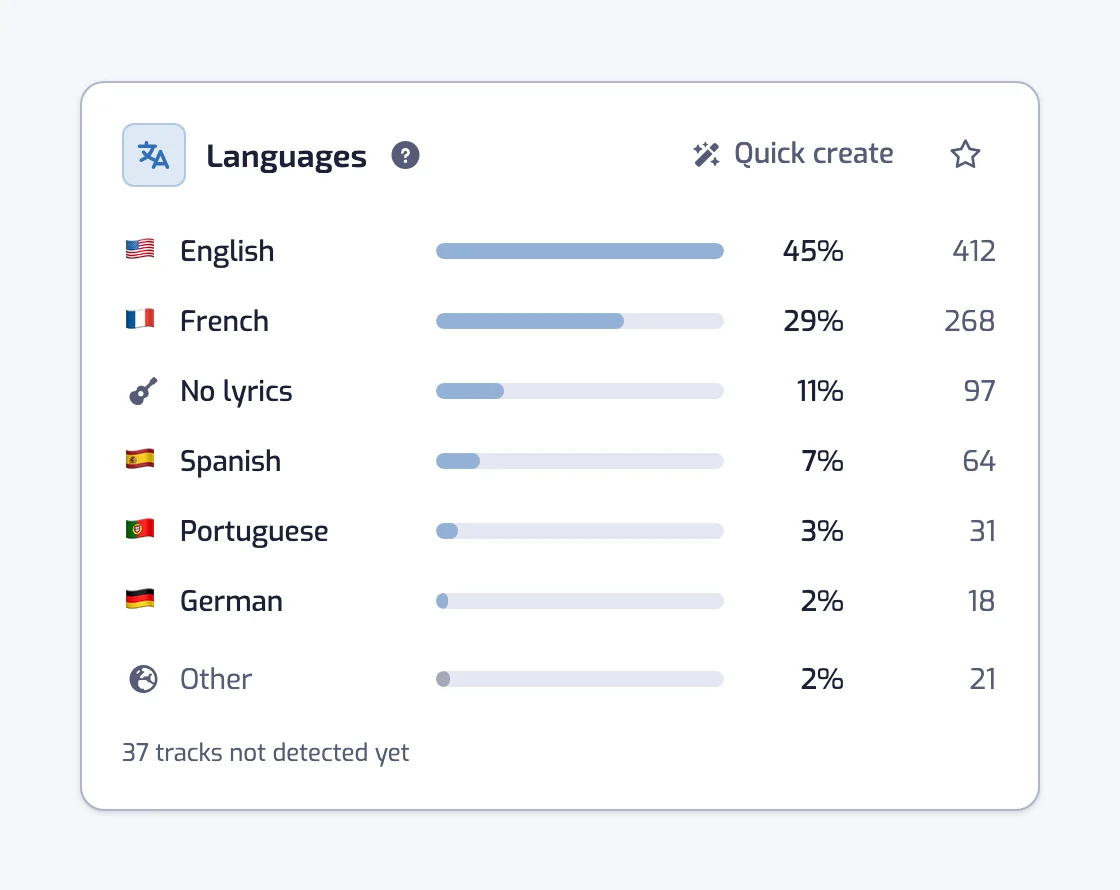
The languages your Liked Songs are sung in, the six most frequent and then Other. Tracks without lyrics count as their own, No lyrics.
The mood, BPM and sound charts on Plus and Pro
From Mood on, the cards of Stats describe how your Liked Songs sound and how your taste moves. They are on Plus and Pro. On the Free plan, the cards below show blurred with a link to the plans, and that includes the mood and BPM charts. When you like is not shown on Free.
Mood map
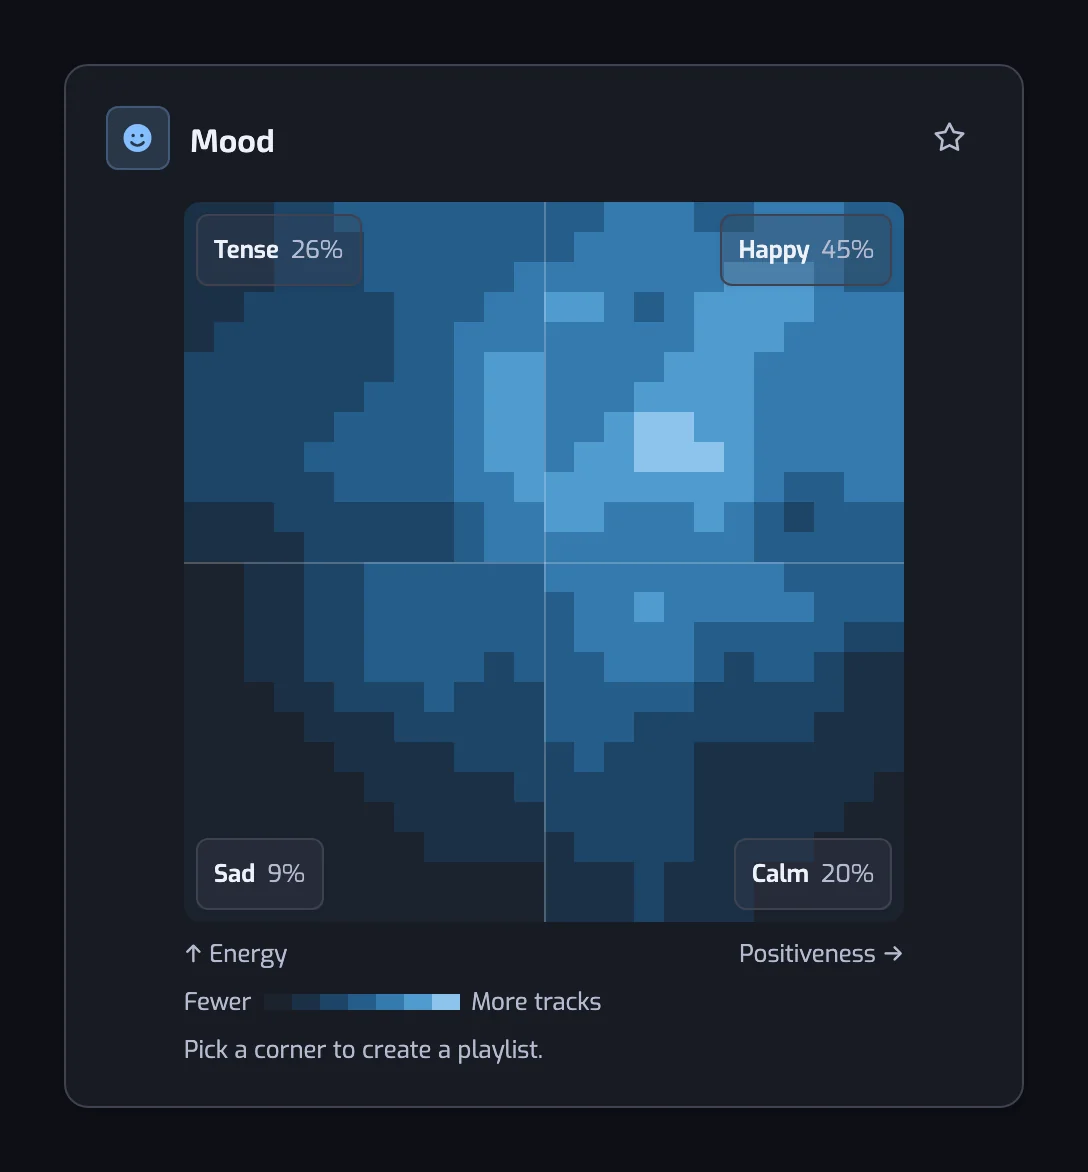
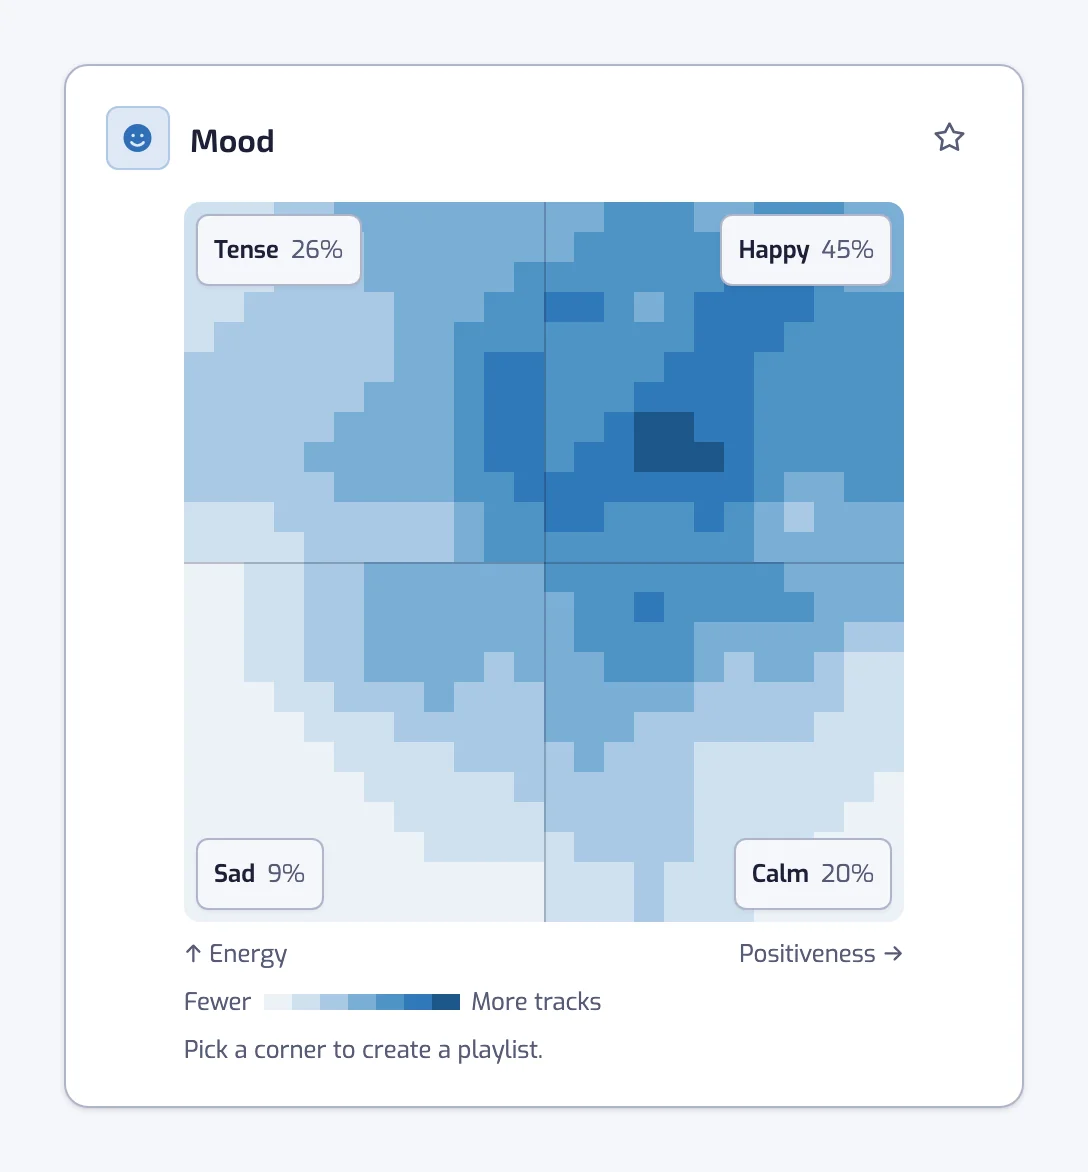
Energy runs up and positiveness runs right. The corners are Calm, Happy, Tense and Sad, each with its share of your tracks. Pick a corner to open the create page with an Energy and a Positiveness filter.
Tempo in BPM
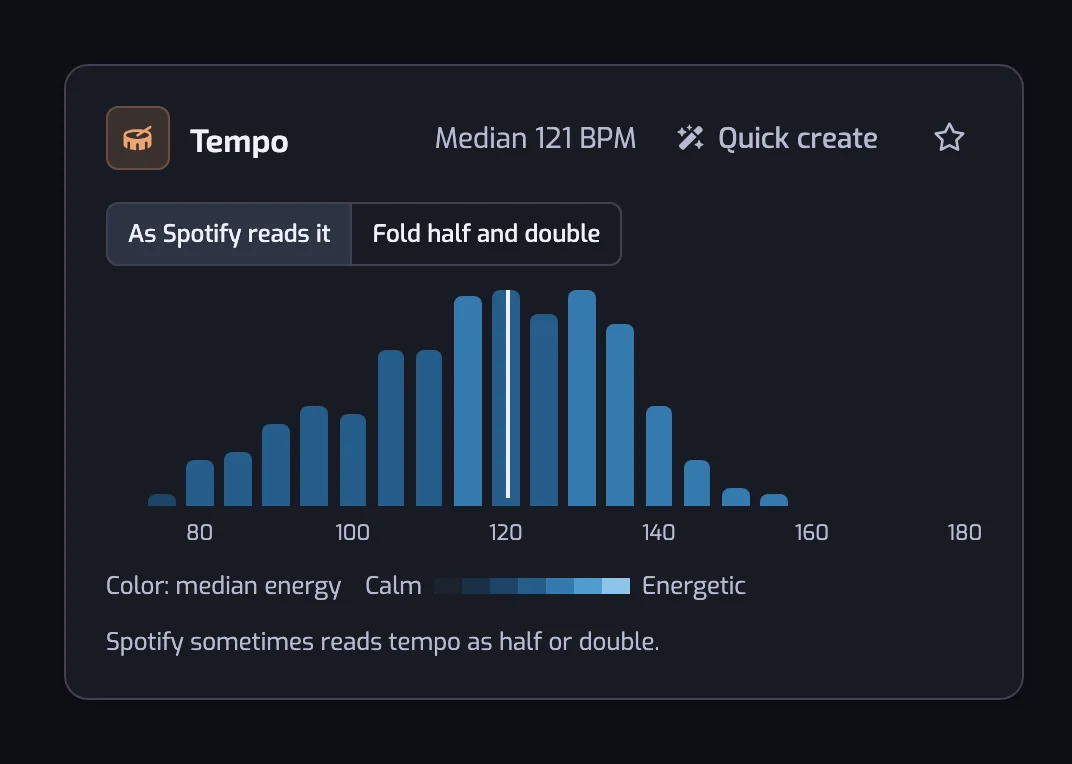
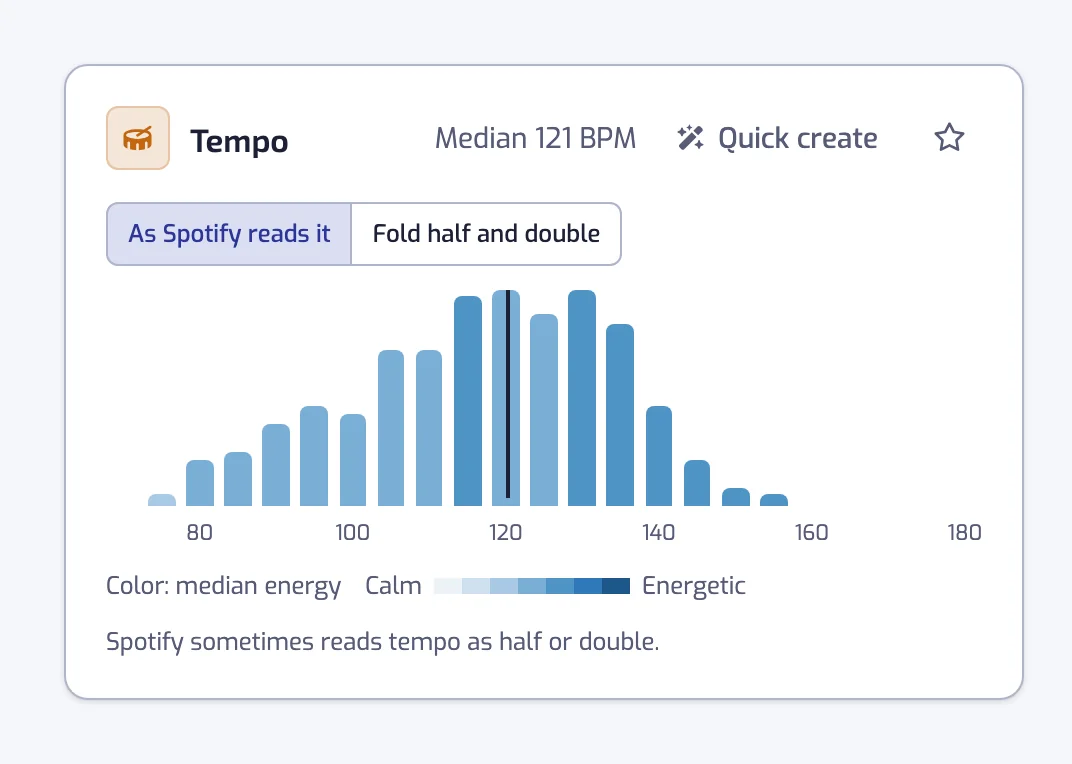
Your tracks in steps of 5 BPM, with the median. The bars open the create page with a Tempo filter over the range you pick.
Sound
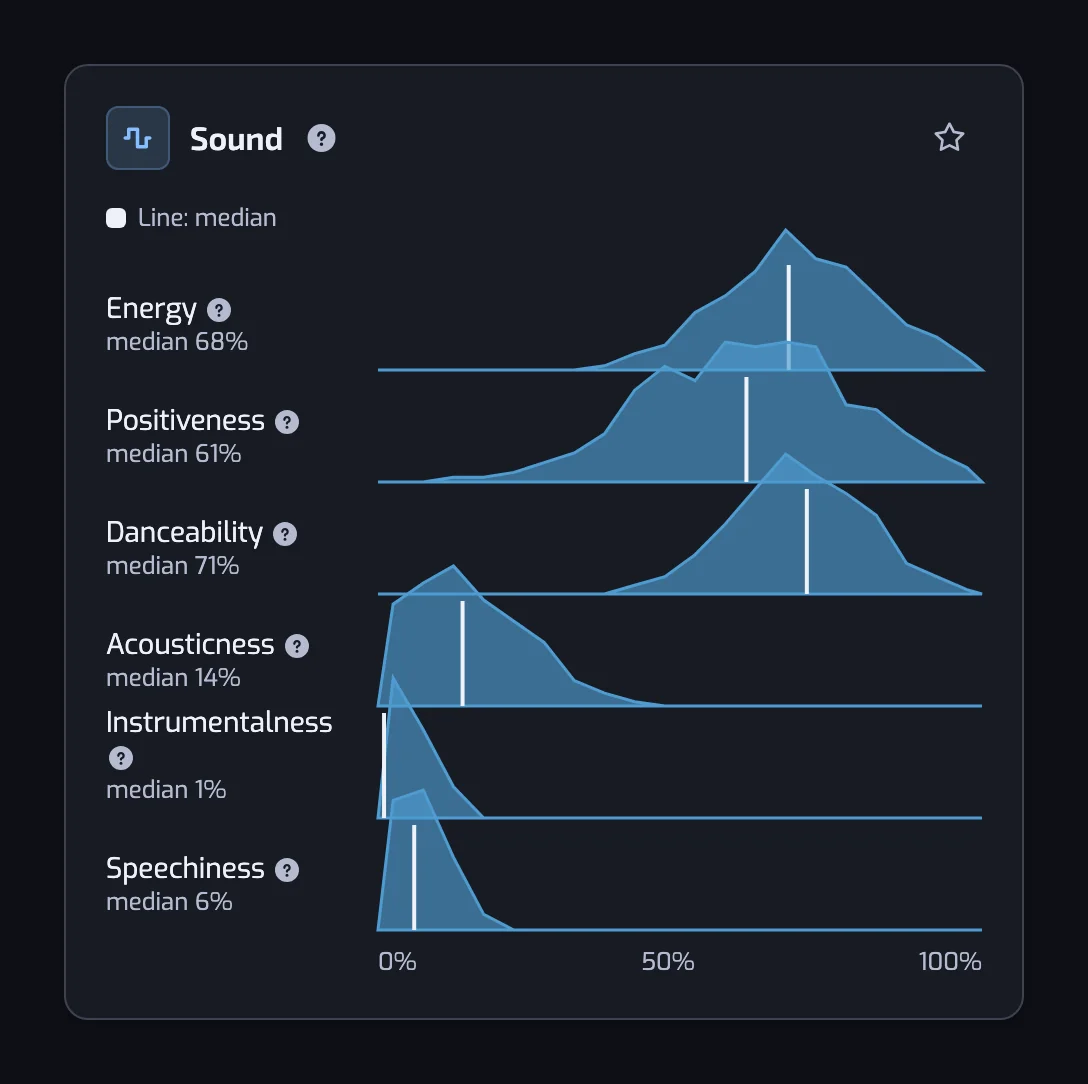
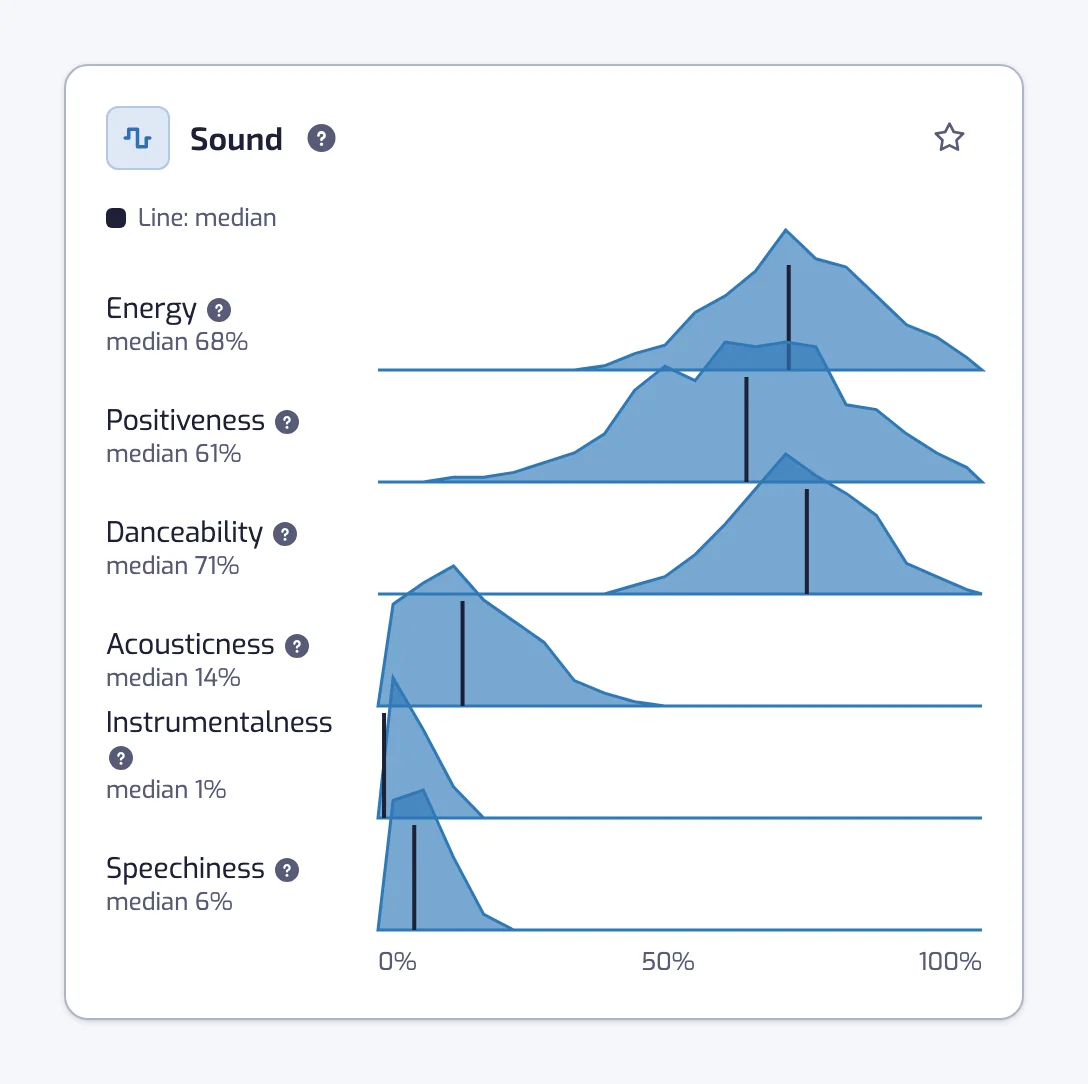
Six scores for your library: energy, positiveness, danceability, acousticness, instrumentalness and speechiness.
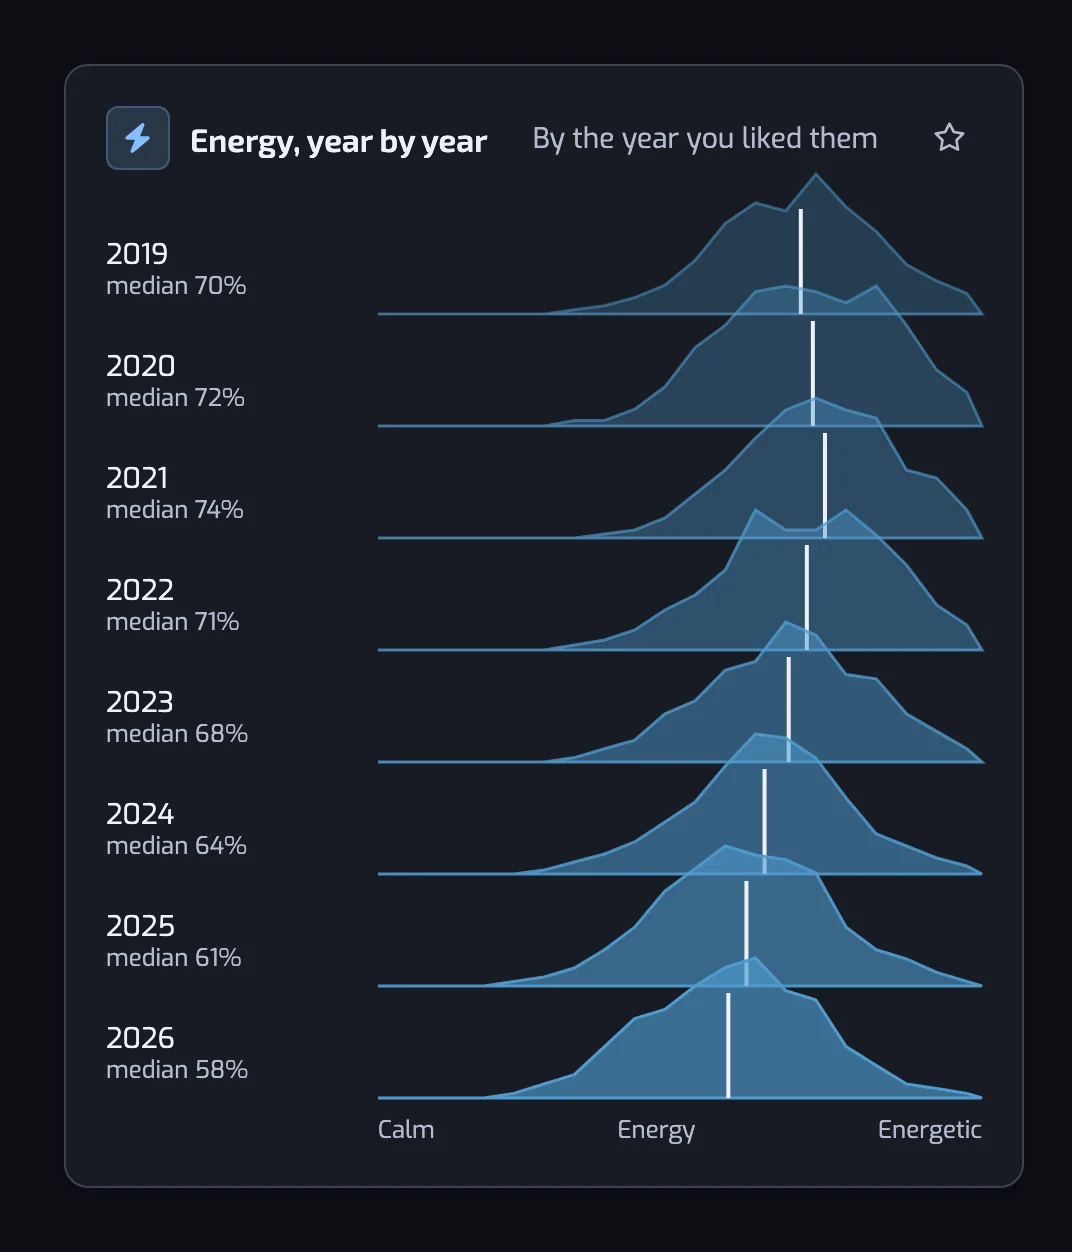
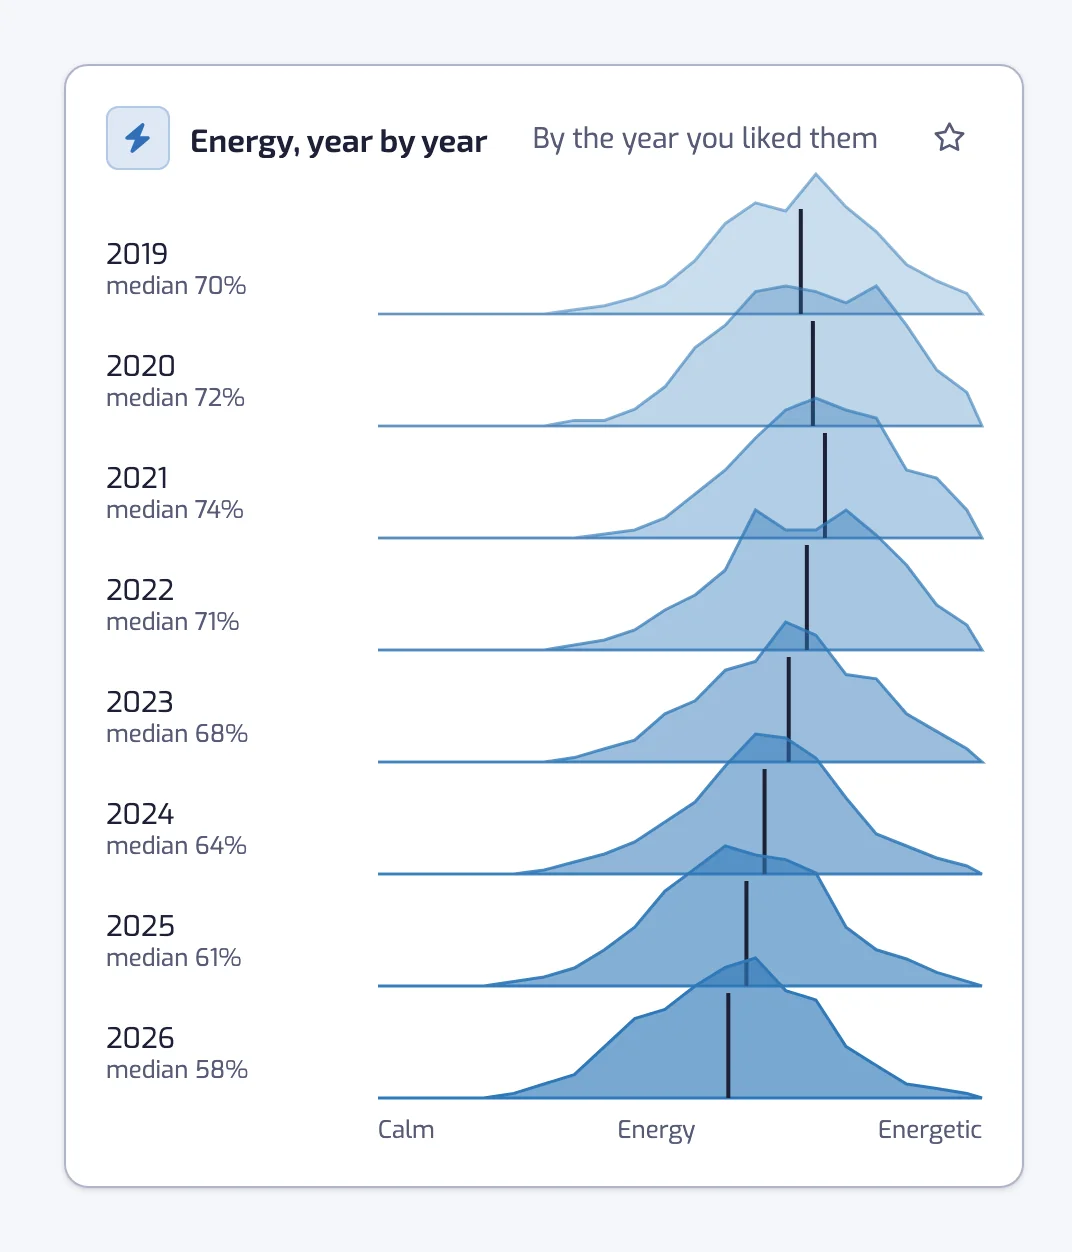
Energy, year by year
How energetic the tracks you liked each year are.
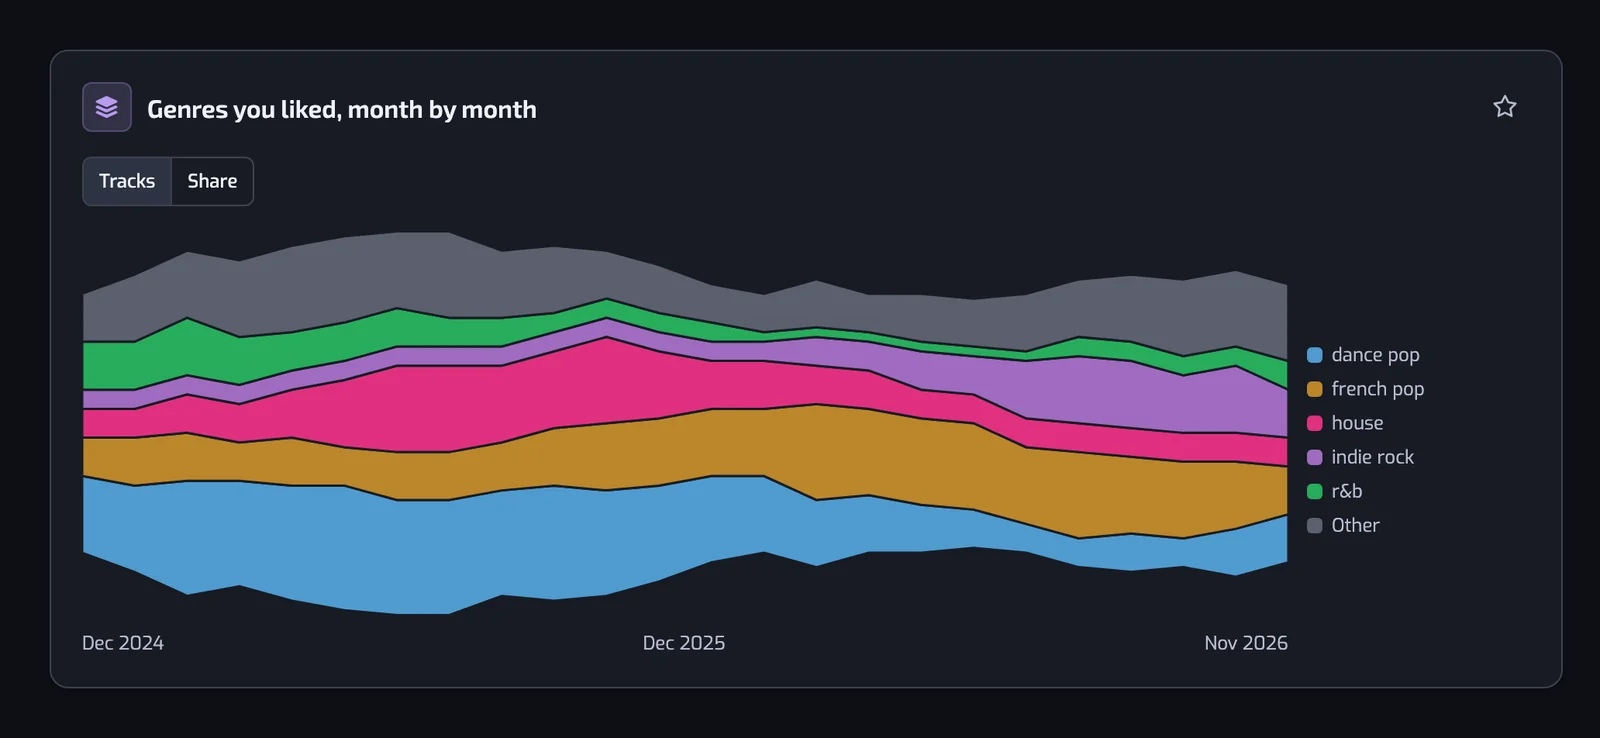
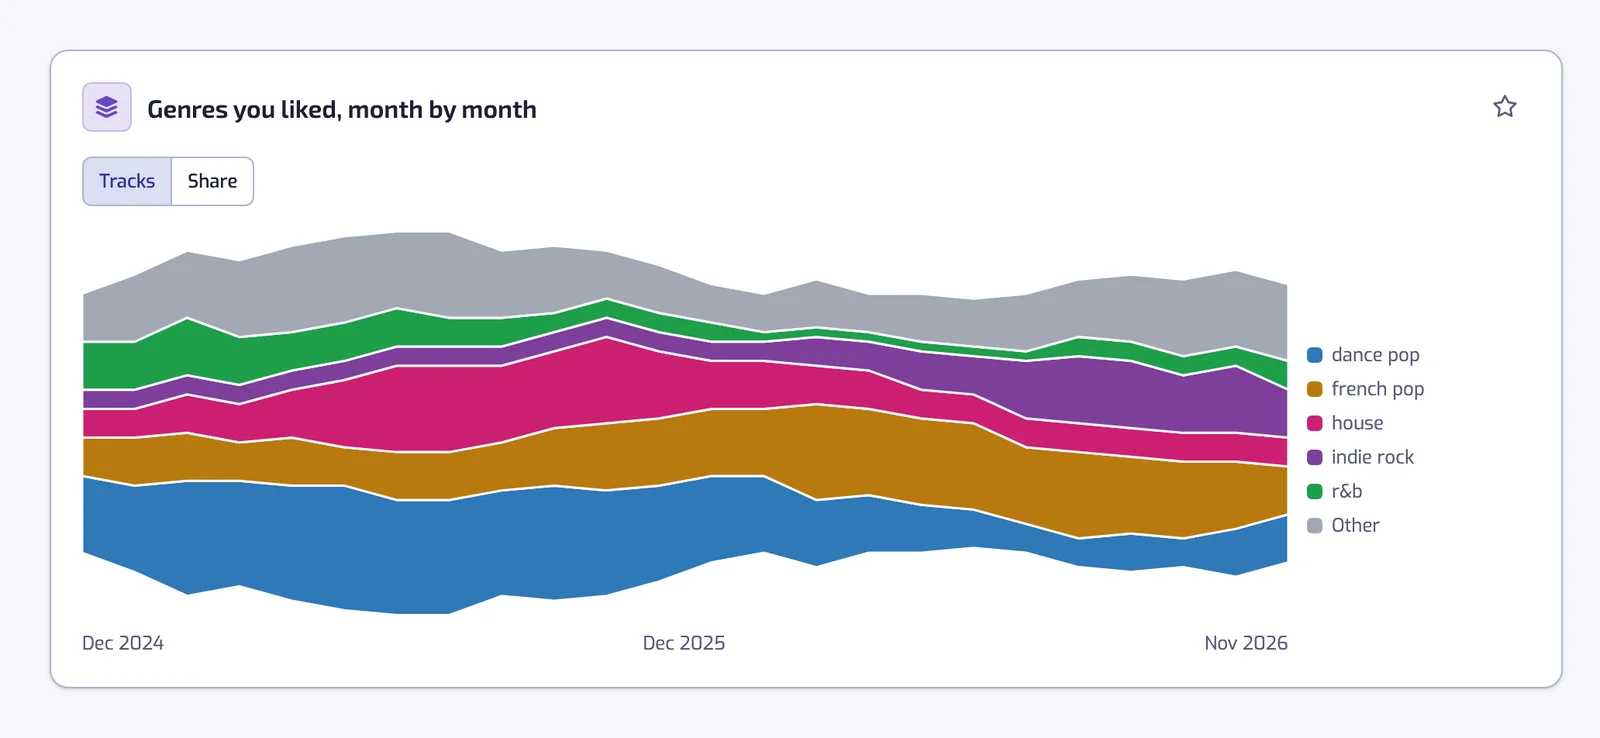
Genres you liked, month by month
Your top five genres over the last two years, month by month, in tracks or as a share of each month.
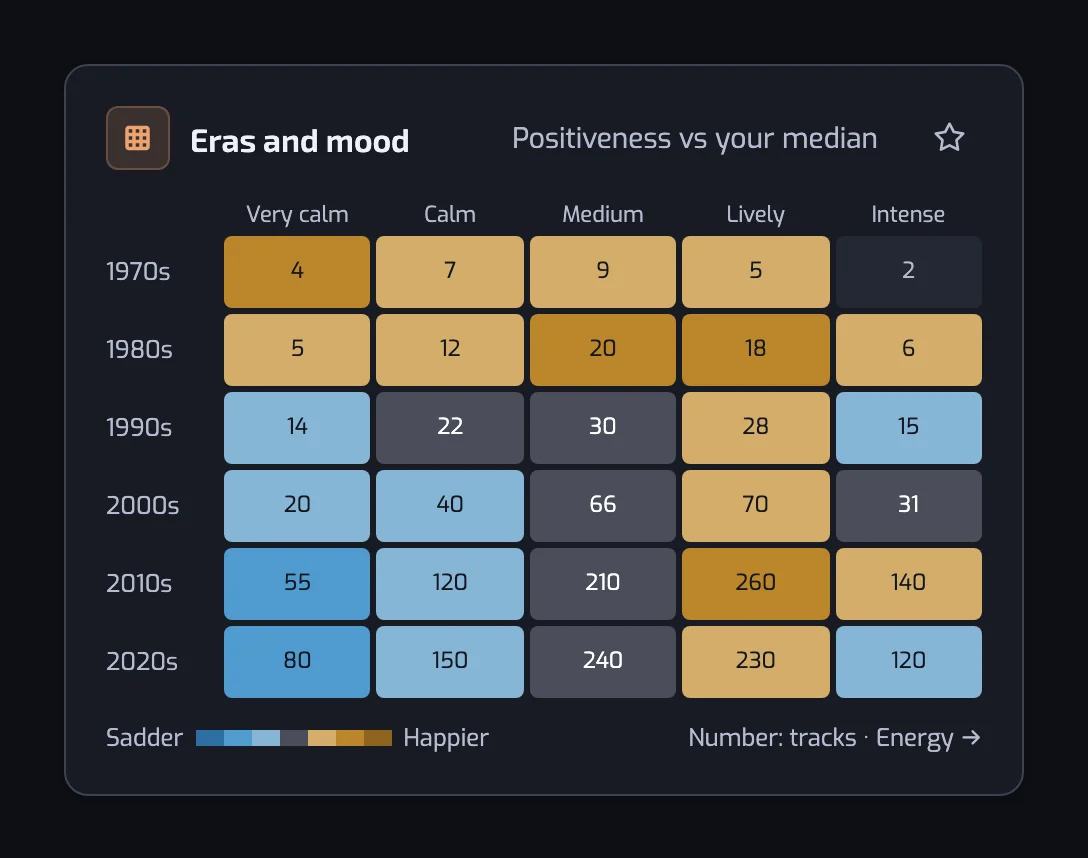
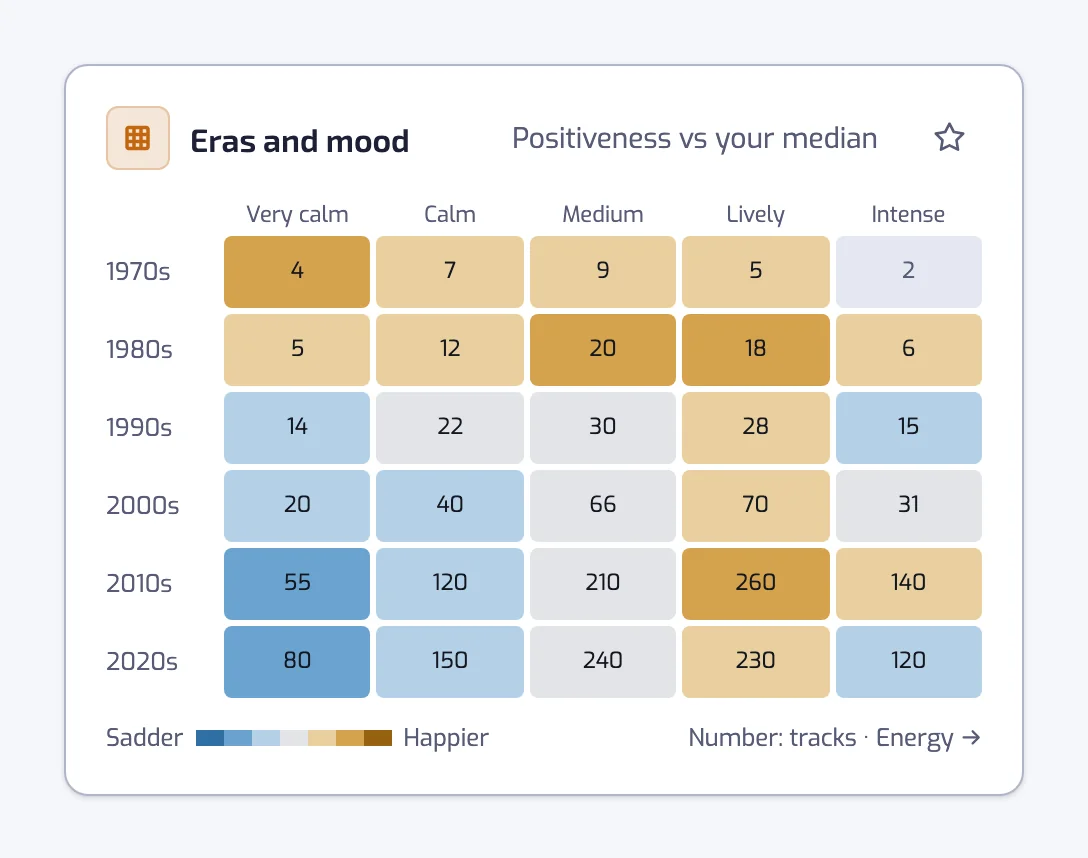
Eras and mood
Your tracks by release decade and energy, happier or sadder than your usual.
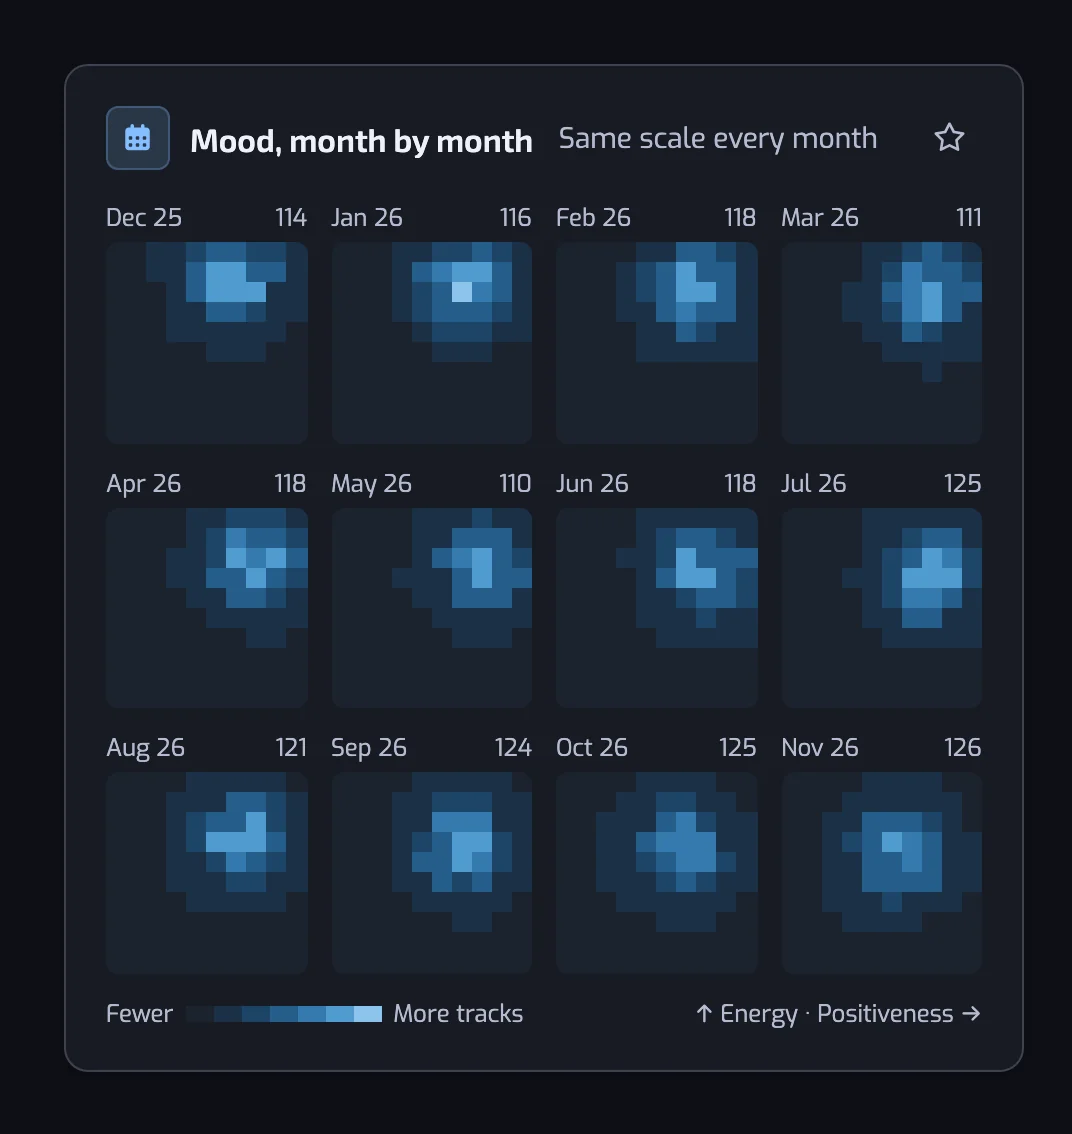
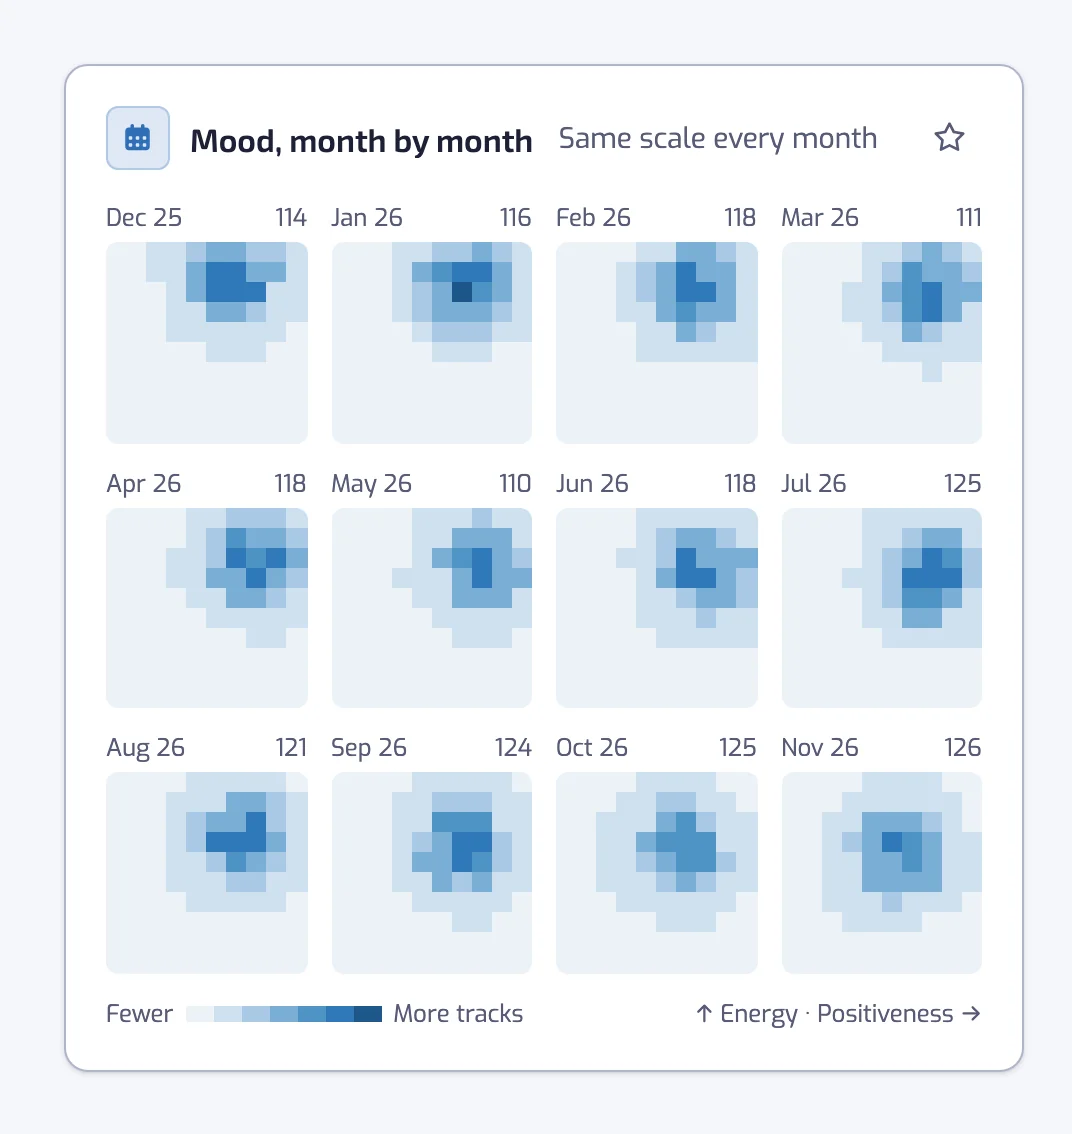
Mood, month by month
The mood of the tracks you liked in recent months.
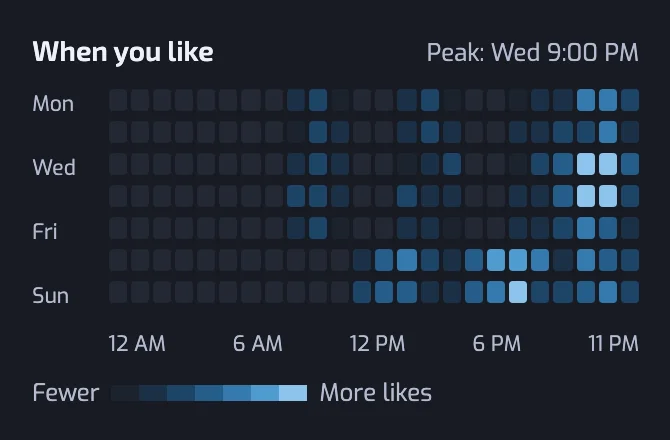
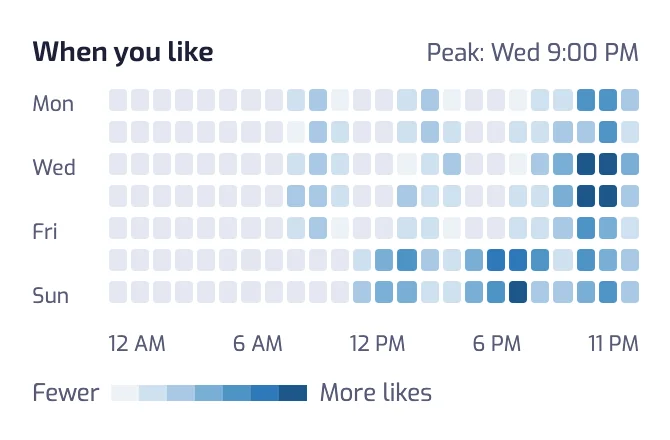
When you like
Your likes of the last year by weekday and hour. It sits beside Likes by day, on Plus and Pro.
From charts to playlists
A card with Quick create turns a slice of your library into a smart playlist: a decade, a genre, an artist, a language, a tempo range or a corner of the mood map. For the filters behind each one, see Liked Songs by mood, by BPM and by genre. Each smart playlist also has its own Stats under Results: see playlist stats. On Pro, you can export your library as a CSV file from the Stats page.
Why the stats stay up to date
The library part refreshes every day on Plus and Pro. On Free, it refreshes when you open Stats and the numbers are more than a day old. It is not instant, so a track you liked this morning may show up tomorrow.
What the stats cover
- Your plan sets the sample. Free covers your 1,000 most recent likes, Plus 3,000 and Pro your whole library. With a bigger library, older likes stay out of the charts.
- Likes, not plays. Playlistation never reads your listening history, so there is no most-played ranking.
- A first wait. The first time you open Stats, the page needs a moment to compute.
The reference for every number is Library stats.
Questions about analyzing Spotify Liked Songs
How do I analyze my Spotify Liked Songs?
Sign in to Playlistation with Spotify and open the Stats page. It draws your Liked Songs as charts, from release years and top artists to mood and BPM. The first time, the page needs a moment to compute them.
Can I see my most played songs?
No. Playlistation never reads your listening history, so the Stats page counts the tracks you liked, not the times you played them. Top artists ranks your artists by how many of your liked tracks they appear on.
Does it analyze my whole library?
It depends on your plan. Free covers your 1,000 most recent likes, Plus 3,000 and Pro your whole library. If you have more liked tracks than your plan monitors, the charts describe the most recent ones.
Can I see the mood and BPM of my Liked Songs on the Free plan?
The mood, tempo and sound cards are part of Plus and Pro. On the Free plan they show blurred with a link to the plans, while the eight charts from release era to languages stay open. When you like is not shown on Free.
How often do the stats update?
On Plus and Pro, the library charts refresh every day. On Free, they refresh when you open the Stats page and the numbers are more than a day old. A track you liked a few hours ago can take until the next refresh to count.
Can I analyze one playlist instead of my Liked Songs?
Yes. Each smart playlist has its own Stats, with the languages, artists, genres and sound of its tracks. Open the playlist, go to Results, and read the Stats section. The playlist stats page lists them.