

Library stats
Library stats
The Stats page gives you an overview of your Liked Songs and of your smart playlists. The library part is computed from the tracks Playlistation monitors for your plan. The playlist part is counted live. With no smart playlist and no library stats yet, the page shows No stats yet with a Create a playlist link instead.
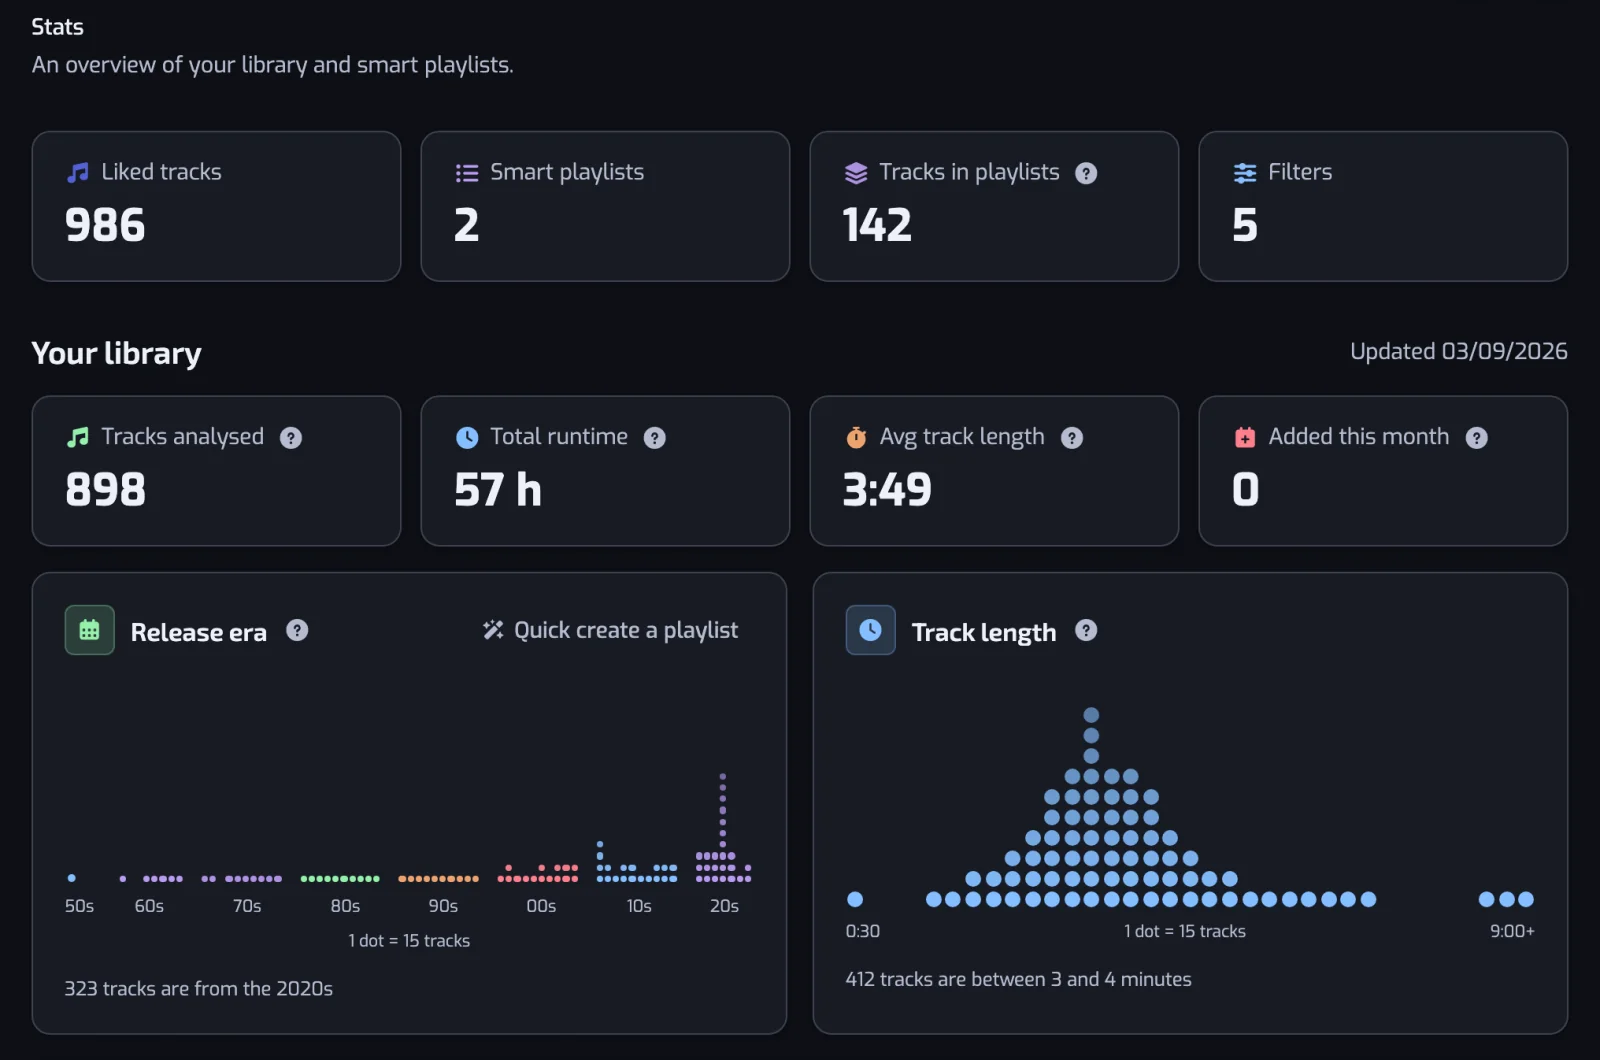
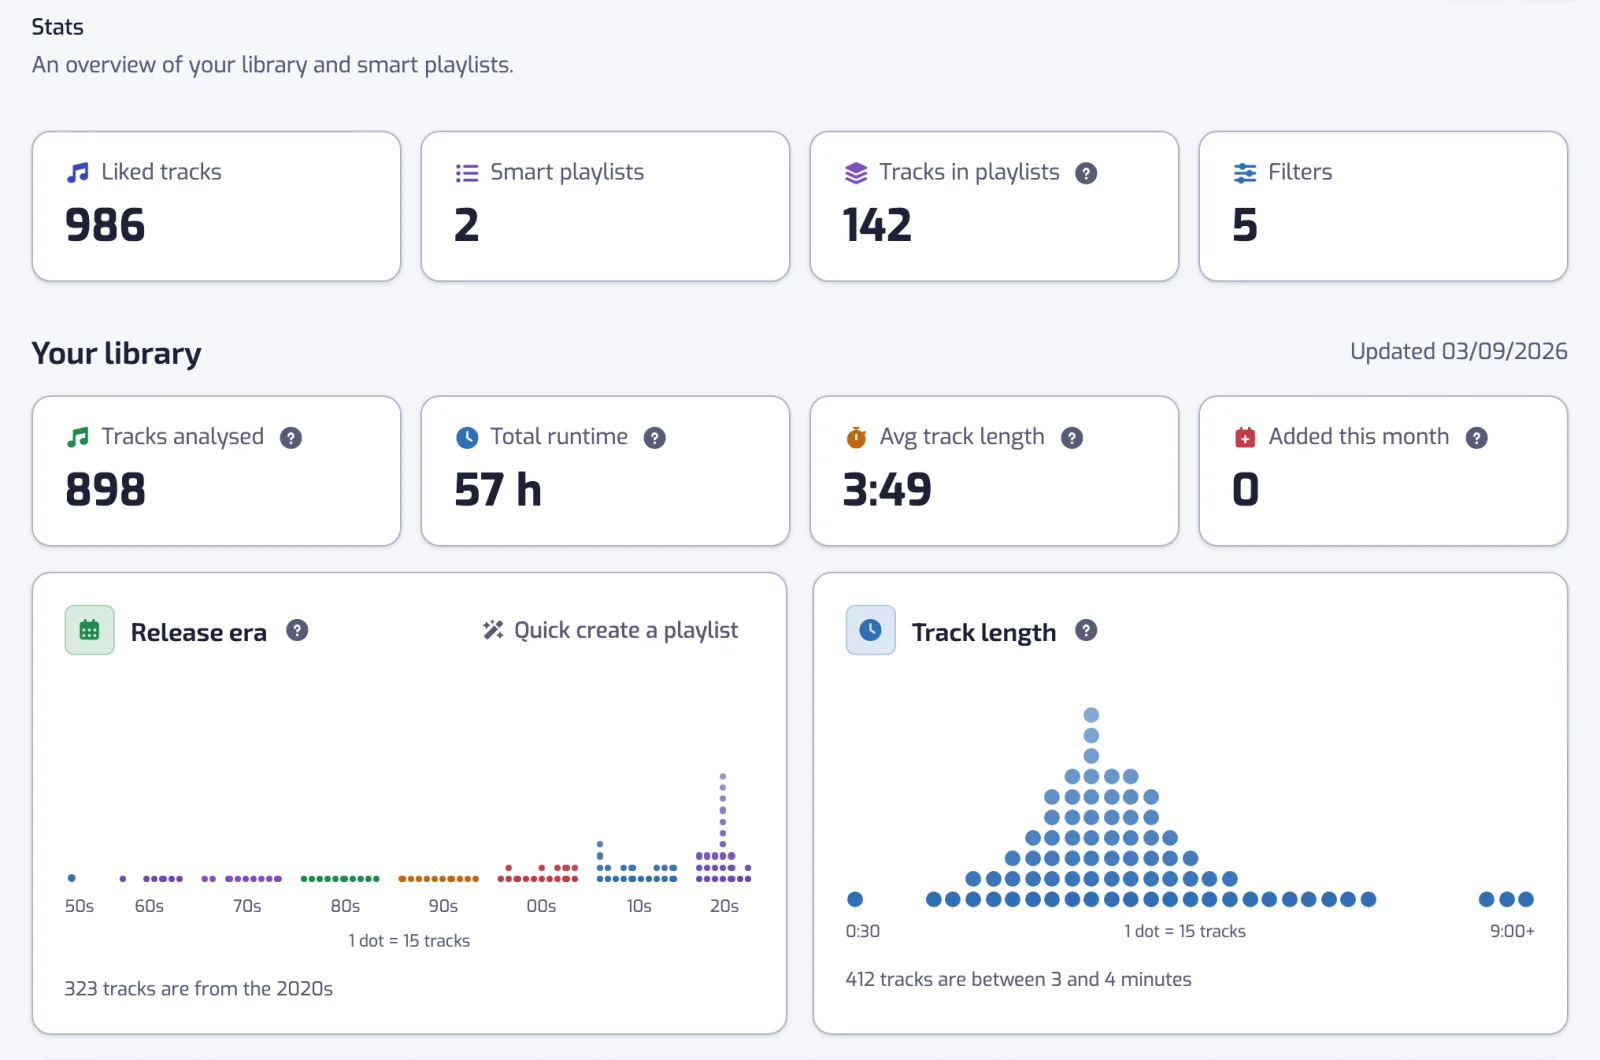
Headline tiles
- Liked tracks: the total number of Liked Songs on your Spotify account, as Spotify reported it the last time Playlistation read your library.
- Smart playlists: your playlists that count toward your plan. A playlist disabled because you are over the plan's quota is not counted.
- Tracks in playlists: the tracks in those playlists, counted once per playlist they are in.
- Filters: the total number of filters across those playlists.
How long are my Liked Songs?
Open the Stats page and read the Total runtime tile in the library section. It adds up the length of every analyzed liked track and shows the total in hours, or in minutes under an hour. Avg track length next to it is that total divided by Tracks analyzed, so a library of 1,000 tracks averaging 3:30 comes to about 58 h.
Three things decide what the number covers:
- Analyzed tracks only. The Free plan monitors your 1,000 most recent likes, Plus 3,000 and Pro your whole library. With a bigger library, Total runtime is the length of those recent likes, not of everything you ever liked. Compare Tracks analyzed with Liked tracks to see whether that applies to you.
- Not live. The library section is refreshed about once a day, so a track you liked this morning may not count yet.
- Track lengths, not listening time. It is how long it would take to play every analyzed track once, end to end.
For the length of one smart playlist rather than your whole library, the playlist's page shows its track count and total length in the header; see The playlist page. To build a playlist from tracks of a given length, use the Duration filter.
Your library
This section is computed from the liked tracks your plan monitors: the 1,000 most recently liked on the Free plan, 3,000 on Plus, your whole library on Pro. If you have more Liked Songs than your plan's limit, every number and chart below describes the most recent ones only. The Updated date in the section header says when it was last computed.
- Tracks analyzed: how many liked tracks the insights are based on. Lower than Liked tracks when your library exceeds your plan's limit.
- Total runtime: the combined length of every analyzed track, rounded to the hour (to the minute under an hour). Not time you spent listening.
- Avg track length: total runtime divided by the number of tracks, rounded to the second.
- Added this month: the tracks you liked during the current calendar month, counted in UTC.
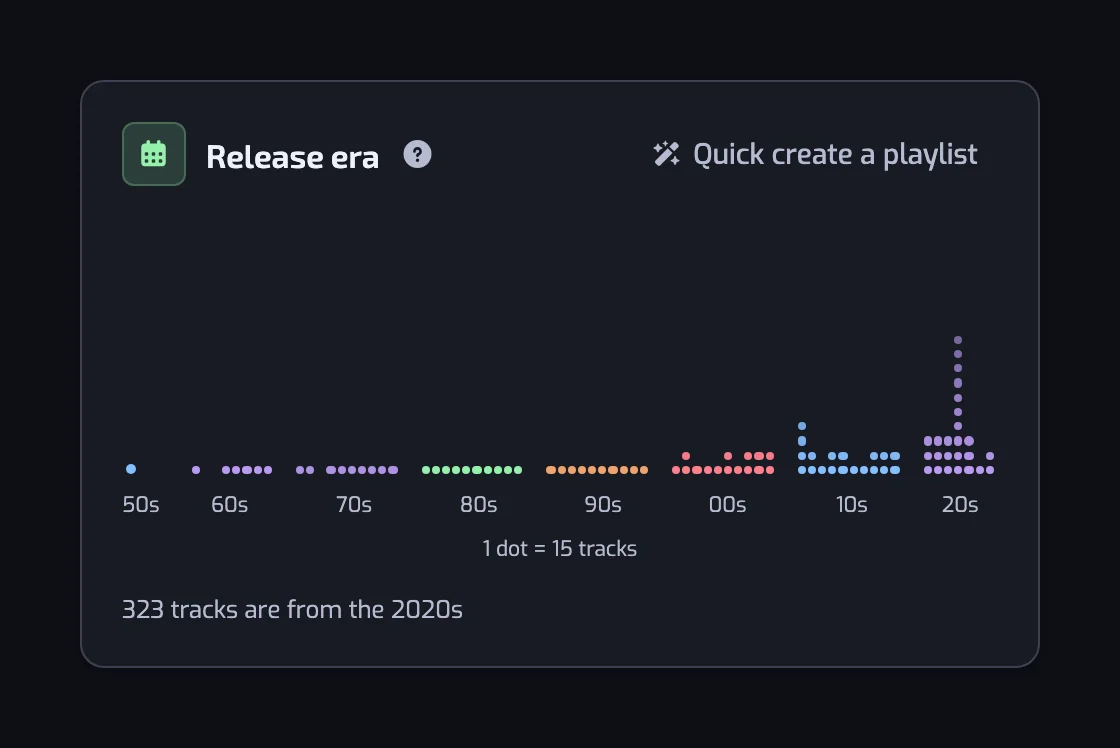
Release era
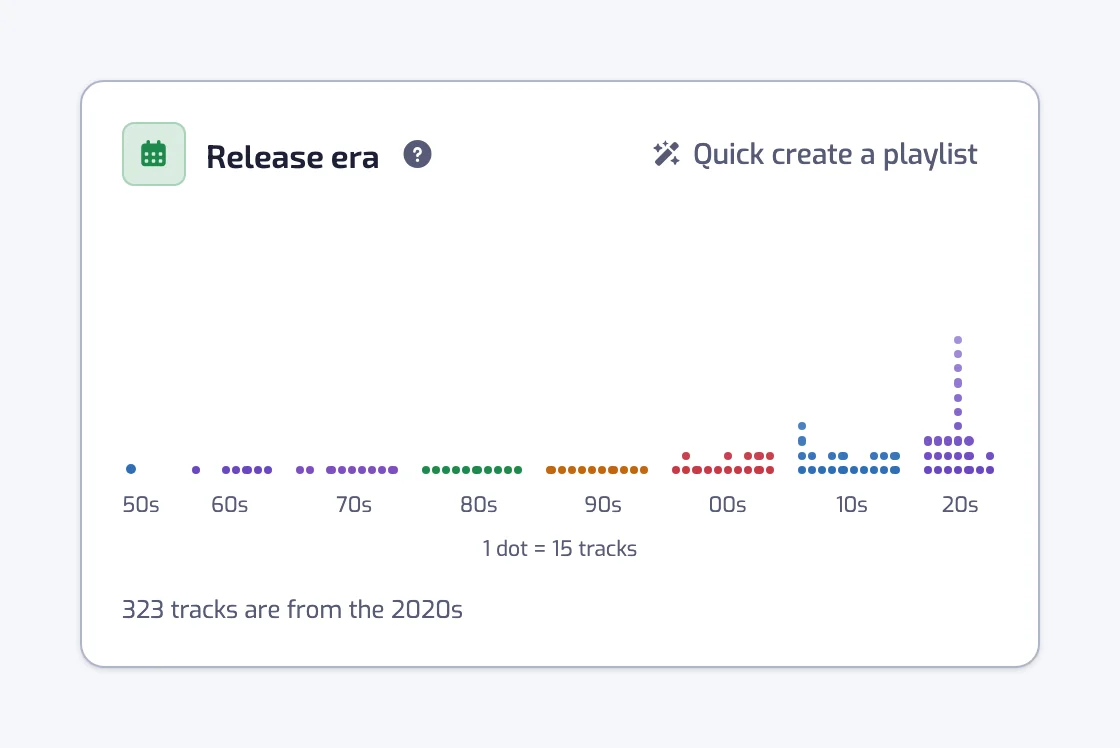
One column per release year, drawn as dots and grouped by decade. The year is the release date of the track's album; a track whose album has no usable release date is left out. Hover or tap a column for the exact count. The legend says how many tracks one dot stands for, and a year with only a few tracks still gets a dot. The caption names the decade with the most tracks: "312 tracks are from the 1990s".
Track length
The same kind of chart, one column per 15 seconds of length. The last column collects everything from 10 minutes up. The caption uses five ranges: under 2 minutes, between 2 and 3, between 3 and 4, between 4 and 5, over 5 minutes.
Likes by day
One square per day over the last 53 weeks: the darker the square, the more tracks you liked that day. The shades are relative to your own year. The days with at least one like are split into four quarters, from fewest likes to most, so one very busy day does not turn every other day pale. The Less to More legend shows the five shades, the palest for a day with no like.
Hover a square, or select the grid and move with the arrow keys, to read its date and count: "12 tracks liked", or "no tracks liked". The line under the grid gives the total, such as "248 tracks liked in the last year". Clicking a square does nothing.
Days follow your device's time zone, unlike Added this month, which counts in UTC. The grid ends on the day the library stats were computed, so tracks you like today appear after the next refresh.
Library growth
The running total of your library, month by month, from your first analyzed like to the current month. Hover or tap the curve to read a month's total. Marked "all time", it appears once the analyzed tracks span at least two months. On a capped plan the curve starts at your oldest monitored like, not at your first like ever.
Top genres
Your six most frequent genres. Genres come from the artists on a track, as Spotify tags them; a track counts once per genre even when several of its artists carry it. Each genre shows up to four of your most frequent artists tagged with it. Genres are looked up for your 500 most frequent artists, so a rare artist's genres may be missing.
Top artists
Your ten most frequent artists with the number of analyzed tracks they appear on. Every credited artist counts, so a featured artist earns a track too. Each row links to the artist's Spotify page.
Top albums
Your six most frequent albums, with cover art and the number of analyzed tracks from each. Each row links to the album on Spotify.
Filter usage
One bar per filter type with how many of your playlists' filters use it, most used first. It appears once you have at least one filter.
Smart playlists
Your playlists with, for each, when its tracks were last synchronized (hover for the exact date), its track count and its filter count. Click a row to open the playlist. The pill above the list states your plan's interval: Auto-updated every 24 h on the Free plan, every 1 h on Plus and every 30 min on Pro. See How syncing works.
When stats refresh
- The library section is recomputed every day on Plus and Pro. On the Free plan, it is recomputed when you open the Stats page and the numbers are more than a day old.
- The first time you open the Stats page, or after Playlistation changes what it computes, the page says "We're crunching your library insights" and queues a computation. Come back a little later.
- The headline tiles, filter usage and the playlist list are not cached. They reflect your playlists as they are now.
Quick create from a chart
Release era, Top genres and Top artists carry a Quick create a playlist button that opens the create page with the matching filter, one Release date filter per decade, an Artist genre filter for the genres, an Artist filter for the artists; the steps are in One-click playlists.
Export your library
On the Pro plan, Export my library (CSV) at the top of the page downloads your Liked Songs as playlistation-liked-songs.csv, a file any spreadsheet opens. It holds your whole library, most recent like first, one row per track, with these columns: Title, Artists, Album, Release date, Duration, Liked at (UTC), Spotify URL, Tempo (BPM), Energy (%), Danceability (%), Positiveness (%), Acousticness (%) and Language. The column names are in English whatever language the app is in. A value Playlistation does not have for a track, such as the audio features of a track Spotify never analyzed, is left empty. When Playlistation holds no copy of your library at that moment, the app says "Your library is being read from Spotify. Try again in a minute." and reads it in the background; the same button a minute later downloads the file.
On Free and Plus the button carries a Pro tag and opens the Subscription page. A playlist's own tracks export from its page: see Download the tracks as CSV.
Common questions
Is there a Spotify playlist length calculator?
Playlistation adds the lengths up for you. The Stats page shows the Total runtime of your analyzed Liked Songs, and the header of each smart playlist's page shows its track count and total length, for example 4 tracks · 17 min.
Does the Stats page show my most-played songs?
No. Playlistation never reads your listening history, so the Stats page counts liked tracks, not plays. Top artists ranks artists by how many of your analyzed liked tracks they appear on.
Why is Tracks analyzed lower than Liked tracks?
Your library is bigger than your plan monitors. The library stats cover your most recent likes only: 1,000 on Free, 3,000 on Plus. Older likes stay out of every chart until you move to a plan that monitors more.